Xcel Energy 2012 Annual Report Download - page 108
Download and view the complete annual report
Please find page 108 of the 2012 Xcel Energy annual report below. You can navigate through the pages in the report by either clicking on the pages listed below, or by using the keyword search tool below to find specific information within the annual report.-
 1
1 -
2
-
3
-
4
-
5
-
6
-
7
-
8
-
9
-
10
-
11
-
12
-
13
-
14
-
15
-
16
-
17
-
18
-
19
-
20
-
21
-
22
-
23
-
24
-
25
-
26
-
27
-
28
-
29
-
30
-
31
-
32
-
33
-
34
-
35
-
36
-
37
-
38
-
39
-
40
-
41
-
42
-
43
-
44
-
45
-
46
-
47
-
48
-
49
-
50
-
51
-
52
-
53
-
54
-
55
-
56
-
57
-
58
-
59
-
60
-
61
-
62
-
63
-
64
-
65
-
66
-
67
-
68
-
69
-
70
-
71
-
72
-
73
-
74
-
75
-
76
-
77
-
78
-
79
-
80
-
81
-
82
-
83
-
84
-
85
-
86
-
87
-
88
-
89
-
90
-
91
-
92
-
93
-
94
-
95
-
96
-
97
-
 98
98 -
 99
99 -
 100
100 -
 101
101 -
 102
102 -
 103
103 -
 104
104 -
 105
105 -
 106
106 -
 107
107 -
 108
108 -
 109
109 -
 110
110 -
 111
111 -
 112
112 -
 113
113 -
 114
114 -
 115
115 -
 116
116 -
 117
117 -
 118
118 -
119
-
120
-
121
-
122
-
123
-
124
-
125
-
126
-
127
-
128
-
129
-
130
-
131
-
132
-
133
-
134
-
135
-
136
-
137
-
138
-
139
-
140
-
141
-
142
-
143
-
144
-
145
-
146
-
147
-
148
-
149
-
150
-
151
-
152
-
153
-
154
-
155
-
156
-
157
-
158
-
159
-
160
-
161
-
162
-
163
-
164
-
165
-
166
-
167
-
168
-
169
-
170
-
171
-
172
 |
 |

98
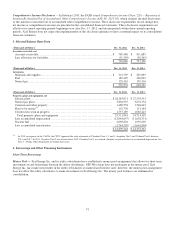
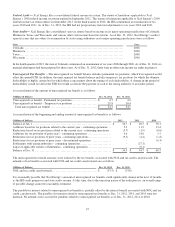
Federal Tax Loss Carryback Claims — Xcel Energy completed an analysis in the first quarter of 2012 on the eligibility of
certain expenses that qualified for an extended carryback beyond the typical two-year carryback period. As a result of a higher tax
rate in prior years, Xcel Energy recognized a discrete tax benefit of approximately $15 million in the first quarter of 2012.
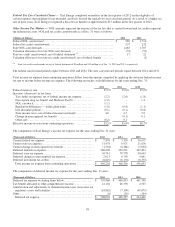
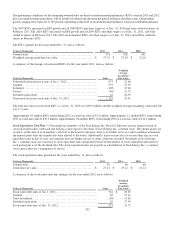
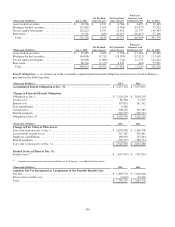
Other Income Tax Matters — NOL amounts represent the amount of the tax loss that is carried forward and tax credits represent
the deferred tax asset. NOL and tax credit carryforwards as of Dec. 31 were as follows:
(Millions of Dollars)
2012
2011
Federal NOL carryforward ........................................................ $ 969
$
1,710
Federal tax credit carryforwards ...................................................
257
232
State NOL carryforwards..........................................................
1,465
1,707
Valuation allowances for state NOL carryforwards ..................................
(52)
(51
)
State tax credit carryforwards, net of federal detriment (a).............................
17
22
Valuation allowances for state tax credit carryforwards, net of federal benefit ..........
-
(2
)
(a) State tax credit carryforwards are net of federal detriment of $9 million and $12 million as of Dec. 31, 2012 and 2011, respectively.
The federal carryforward periods expire between 2021 and 2032. The state carryforward periods expire between 2014 and 2031.
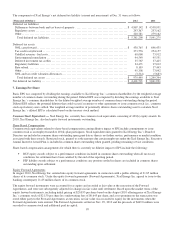
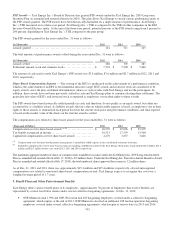
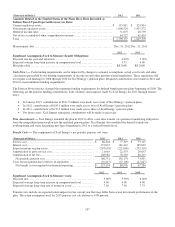
Total income tax expense from continuing operations differs from the amount computed by applying the statutory federal income
tax rate to income before income tax expense. The following reconciles such differences for the years ending Dec. 31:
2012
2011
2010
Federal statutory rate................................
..............
35.0
%
35.0
%
35.0
%
Increases (decreases) in tax from:
Tax credits recognized, net of federal income tax expense
..........
(2.2
)
(2.6
)
(1.8
)
Prescription drug tax benefit and Medicare Part D
.................
(1.2
)
-
1.4
NOL carryback................................
.................
(1.1
)
-
-
Regulatory differences — utility plant items
......................
(1.0
)
(0.8
)
(1.1
)
Life insurance policies ................................
..........
(0.1
)
(0.1
)
(0.8
)
State income taxes, net of federal income tax benefit
..............
4.0
4.3
3.9
Change in unrecognized tax benefits
.............................
-
(0.1
)
0.1
Other, net ................................
......................
(0.2
)
0.1
-
Effective income tax rate from continuing operations
................
33.2
%
35.8
%
36.7
%
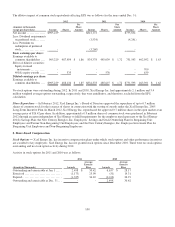
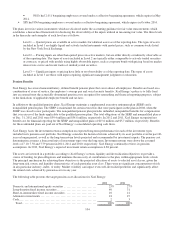
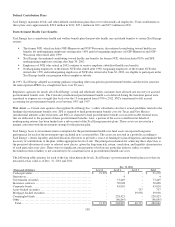
The components of Xcel Energy’s income tax expense for the years ending Dec. 31 were:
(Thousands of Dollars)
2012
2011
2010
Current federal tax expense................................
........
$
7,876
$
3,399
$
16,657
Current state tax expense ................................
..........
31,478
9,971
11,636
Current change in unrecognized tax benefits
........................
(1,704
)
(8,266
)
(2,982
)
Deferred federal tax expense................................
.......
366,409
383,931
362,393
Deferred state tax expense................................
.........
50,741
78,770
50,643
Deferred change in unrecognized tax expense
.......................
2,013
6,705
4,641
Deferred investment tax credits ................................
....
(6,610
)
(6,194
)
(6,353
)
Total income tax expense from continuing operations
..............
$
450,203
$
468,316
$
436,635
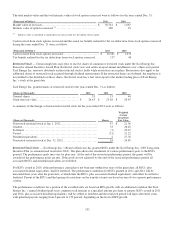
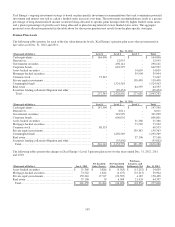
The components of deferred income tax expense for the years ending Dec. 31 were:
(Thousands of Dollars)
2012
2011
2010
Deferred tax expense excluding items below
........................
$
559,860
$
446,893
$
461,748
Tax benefit allocated to other comprehensive income
................
12,102
26,798
2,535
Amortization and adjustments to deferred income taxes on income tax
regulatory assets and liabilities ................................
...
(63,862)
(7,108)
(49,679
)
Other ................................
............................
(6)
(16)
(144
)
Deferred tax expense ................................
............
$
508,094
$
466,567
$
414,460