Xcel Energy 2012 Annual Report Download - page 120
Download and view the complete annual report
Please find page 120 of the 2012 Xcel Energy annual report below. You can navigate through the pages in the report by either clicking on the pages listed below, or by using the keyword search tool below to find specific information within the annual report.-
 1
1 -
2
-
3
-
4
-
5
-
6
-
7
-
8
-
9
-
10
-
11
-
12
-
13
-
14
-
15
-
16
-
17
-
18
-
19
-
20
-
21
-
22
-
23
-
24
-
25
-
26
-
27
-
28
-
29
-
30
-
31
-
32
-
33
-
34
-
35
-
36
-
37
-
38
-
39
-
40
-
41
-
42
-
43
-
44
-
45
-
46
-
47
-
48
-
49
-
50
-
51
-
52
-
53
-
54
-
55
-
56
-
57
-
58
-
59
-
60
-
61
-
62
-
63
-
64
-
65
-
66
-
67
-
68
-
69
-
70
-
71
-
72
-
73
-
74
-
75
-
76
-
77
-
78
-
79
-
80
-
81
-
82
-
83
-
84
-
85
-
86
-
87
-
88
-
89
-
90
-
91
-
92
-
93
-
94
-
95
-
96
-
97
-
98
-
99
-
100
-
101
-
102
-
103
-
104
-
105
-
106
-
107
-
108
-
109
-
 110
110 -
 111
111 -
 112
112 -
 113
113 -
 114
114 -
 115
115 -
 116
116 -
 117
117 -
 118
118 -
 119
119 -
 120
120 -
 121
121 -
 122
122 -
 123
123 -
 124
124 -
 125
125 -
 126
126 -
 127
127 -
 128
128 -
 129
129 -
 130
130 -
131
-
132
-
133
-
134
-
135
-
136
-
137
-
138
-
139
-
140
-
141
-
142
-
143
-
144
-
145
-
146
-
147
-
148
-
149
-
150
-
151
-
152
-
153
-
154
-
155
-
156
-
157
-
158
-
159
-
160
-
161
-
162
-
163
-
164
-
165
-
166
-
167
-
168
-
169
-
170
-
171
-
172
 |
 |

110
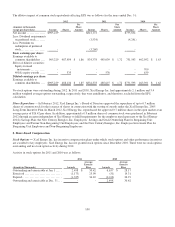
(Thousands of Dollars)
2012
2011
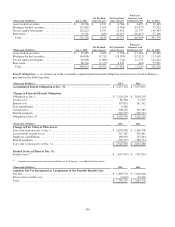
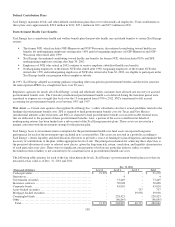
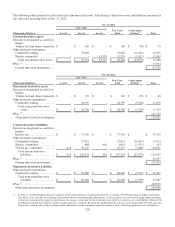
Change in Fair Value of Plan Assets:
Fair value of plan assets at Jan. 1................................
..................
$
426,835
$
432,230
Actual return on plan assets ................................
......................
56,385
535
Plan participants’ contributions ................................
...................
14,241
15,690
Employer contributions ................................
..........................
47,143
49,018
Benefit payments ................................
................................
(63,762)
(70,638
)
Fair value of plan assets at Dec. 31 ................................
................
$
480,842
$
426,835
(Thousands of Dollars)
2012
2011
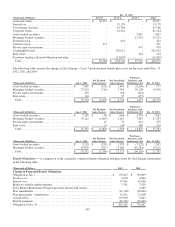
Funded Status of Plans at Dec. 31:
Funded status ................................................................
...
$
(371,110)
$
(350,012
)
Current assets ................................................................
...
-
332
Current liabilities ................................
................................
(6,070)
(7,594
)
Noncurrent liabilities ................................
............................
(365,040)
(342,750
)
Net postretirement amounts recognized on consolidated balance sheets
...............
$
(371,110)
$
(350,012
)
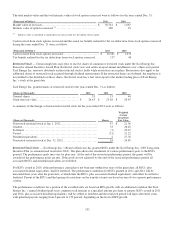
(Thousands of Dollars)
2012
2011
Amounts Not Yet Recognized as Components of Net Periodic Benefit Cost:
Net loss................................................................
.........
$
321,946
$
246,846
Prior service credit................................
...............................
(84,228)
(50,652
)
Transition obligation................................
.............................
827
15,147
Total ................................................................
...........
$
238,545
$
211,341
(Thousands of Dollars)
2012
2011
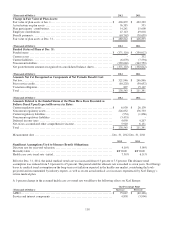
Amounts Related to the Funded Status of the Plans Have Been Recorded as
Follows Based Upon Expected Recovery in Rates:
Current regulatory assets ................................
.........................
$
6,930
$
26,139
Noncurrent regulatory assets................................
......................
226,052
176,730
Current regulatory liabilities ................................
......................
(954)
(1,866
)
Noncurrent regulatory liabilities ................................
..................
(3,453)
-
Deferred income taxes ................................
...........................
4,050
4,207
Net-of-tax accumulated other comprehensive income
...............................
5,920
6,131
Total ................................................................
...........
$
238,545
$
211,341
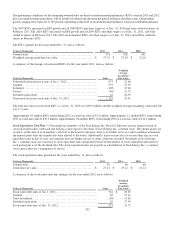
Measurement date ................................
...............................
Dec. 31, 2012
Dec. 31, 2011
2012
2011
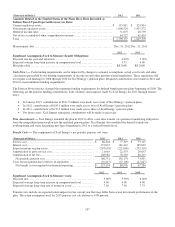
Significant Assumptions Used to Measure Benefit Obligations:
Discount rate for year-end valuation................................
...............
4.10
%
5.00
%
Mortality table ................................................................
..
RP 2000 RP 2000
Health care costs trend rate - initial................................
................
7.50
%
6.31
%
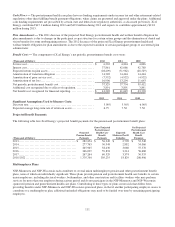
Effective Dec. 31, 2012, the initial medical trend rate was increased from 6.3 percent to 7.5 percent. The ultimate trend
assumption was reduced from 5.0 percent to 4.5 percent. The period until the ultimate rate is reached is seven years. Xcel Energy
bases its medical trend assumption on the long-term cost inflation expected in the health care market, considering the levels
projected and recommended by industry experts, as well as recent actual medical cost increases experienced by Xcel Energy’s
retiree medical plan.
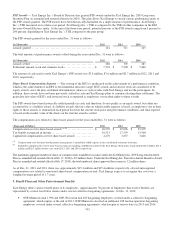
A 1-percent change in the assumed health care cost trend rate would have the following effects on Xcel Energy:
One Percentage Point
(Thousands of Dollars)
Increase
Decrease
APBO ................................................................
..........
$
75,047
$
(60,326
)
Service and interest components ................................
..................
4,850
(3,904
)