Xcel Energy 2012 Annual Report Download - page 91
Download and view the complete annual report
Please find page 91 of the 2012 Xcel Energy annual report below. You can navigate through the pages in the report by either clicking on the pages listed below, or by using the keyword search tool below to find specific information within the annual report.-
 1
1 -
2
-
3
-
4
-
5
-
6
-
7
-
8
-
9
-
10
-
11
-
12
-
13
-
14
-
15
-
16
-
17
-
18
-
19
-
20
-
21
-
22
-
23
-
24
-
25
-
26
-
27
-
28
-
29
-
30
-
31
-
32
-
33
-
34
-
35
-
36
-
37
-
38
-
39
-
40
-
41
-
42
-
43
-
44
-
45
-
46
-
47
-
48
-
49
-
50
-
51
-
52
-
53
-
54
-
55
-
56
-
57
-
58
-
59
-
60
-
61
-
62
-
63
-
64
-
65
-
66
-
67
-
68
-
69
-
70
-
71
-
72
-
73
-
74
-
75
-
76
-
77
-
78
-
79
-
80
-
 81
81 -
 82
82 -
 83
83 -
 84
84 -
 85
85 -
 86
86 -
 87
87 -
 88
88 -
 89
89 -
 90
90 -
 91
91 -
 92
92 -
 93
93 -
 94
94 -
 95
95 -
 96
96 -
 97
97 -
 98
98 -
 99
99 -
 100
100 -
 101
101 -
102
-
103
-
104
-
105
-
106
-
107
-
108
-
109
-
110
-
111
-
112
-
113
-
114
-
115
-
116
-
117
-
118
-
119
-
120
-
121
-
122
-
123
-
124
-
125
-
126
-
127
-
128
-
129
-
130
-
131
-
132
-
133
-
134
-
135
-
136
-
137
-
138
-
139
-
140
-
141
-
142
-
143
-
144
-
145
-
146
-
147
-
148
-
149
-
150
-
151
-
152
-
153
-
154
-
155
-
156
-
157
-
158
-
159
-
160
-
161
-
162
-
163
-
164
-
165
-
166
-
167
-
168
-
169
-
170
-
171
-
172
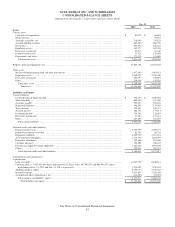
 |
 |

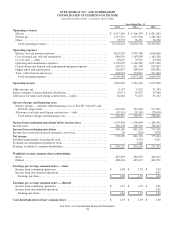
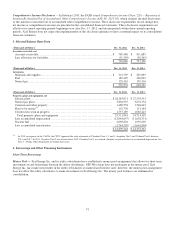
XCEL ENERGY INC. AND SUBSIDIARIES
CONSOLIDATED BALANCE SHEETS
(amounts in thousands, except share and per share data)
See Notes to Consolidated Financial Statements
81
Dec. 31
2012
2011
Assets
Current assets
Cash and cash equivalents................................................................... $
82,323
$
60,684
Restricted cash ...........................................................................
-
95,287
Accounts receivable, net ....................................................................
718,046
753,120
Accrued unbilled revenues ..................................................................
663,363
688,740
Inventories ..............................................................................
535,574
618,232
Regulatory assets .........................................................................
352,977
402,235
Derivative instruments .....................................................................
69,013
64,340
Deferred income taxes .....................................................................
32,528
178,446
Prepayments and other .....................................................................
171,315
121,480
Total current assets......................................................................
2,625,139
2,982,564
Property, plant and equipment, net...............................................................
23,809,348
22,353,367
Other assets
Nuclear decommissioning fund and other investments ..............................................
1,617,865
1,463,515
Regulatory assets .........................................................................
2,762,029
2,389,008
Derivative instruments .....................................................................
126,297
152,887
Other ..................................................................................
200,008
155,926
Total other assets .......................................................................
4,706,199
4,161,336
Total assets ......................................................................... $
31,140,686
$
29,497,267
Liabilities and Equity
Current liabilities
Current portion of long-term debt ............................................................. $
258,155
$
1,059,922
Short-term debt ..........................................................................
602,000
219,000
Accounts payable .........................................................................
959,093
902,078
Regulatory liabilities.......................................................................
168,858
275,095
Taxes accrued ...........................................................................
334,441
289,713
Accrued interest ..........................................................................
162,494
177,111
Dividends payable ........................................................................
131,748
126,487
Derivative instruments .....................................................................
32,482
157,414
Other ..................................................................................
287,802
381,819
Total current liabilities ...................................................................
2,937,073
3,588,639
Deferred credits and other liabilities
Deferred income taxes .....................................................................
4,434,909
4,020,377
Deferred investment tax credits ...............................................................
82,761
86,743
Regulatory liabilities.......................................................................
1,059,939
1,101,534
Asset retirement obligations .................................................................
1,719,796
1,651,793
Derivative instruments .....................................................................
242,866
263,906
Customer advances........................................................................
252,888
248,345
Pension and employee benefit obligations .......................................................
1,163,265
1,001,906
Other ..................................................................................
229,207
203,313
Total deferred credits and other liabilities .....................................................
9,185,631
8,577,917
Commitments and contingencies
Capitalization
Long-term debt...........................................................................
10,143,905
8,848,513
Common stock — 1,000,000,000 shares authorized of $2.50 par value; 487,959,516 and 486,493,933 shares
outstanding at Dec. 31, 2012 and Dec. 31, 2011, respectively .......................................
1,219,899
1,216,234
Additional paid in capital ...................................................................
5,353,015
5,327,443
Retained earnings.........................................................................
2,413,816
2,032,556
Accumulated other comprehensive loss .........................................................
(112,653)
(94,035)
Total common stockholders’ equity..........................................................
8,874,077
8,482,198
Total liabilities and equity .............................................................. $
31,140,686
$
29,497,267