Xcel Energy 2012 Annual Report Download - page 109
Download and view the complete annual report
Please find page 109 of the 2012 Xcel Energy annual report below. You can navigate through the pages in the report by either clicking on the pages listed below, or by using the keyword search tool below to find specific information within the annual report.-
 1
1 -
2
-
3
-
4
-
5
-
6
-
7
-
8
-
9
-
10
-
11
-
12
-
13
-
14
-
15
-
16
-
17
-
18
-
19
-
20
-
21
-
22
-
23
-
24
-
25
-
26
-
27
-
28
-
29
-
30
-
31
-
32
-
33
-
34
-
35
-
36
-
37
-
38
-
39
-
40
-
41
-
42
-
43
-
44
-
45
-
46
-
47
-
48
-
49
-
50
-
51
-
52
-
53
-
54
-
55
-
56
-
57
-
58
-
59
-
60
-
61
-
62
-
63
-
64
-
65
-
66
-
67
-
68
-
69
-
70
-
71
-
72
-
73
-
74
-
75
-
76
-
77
-
78
-
79
-
80
-
81
-
82
-
83
-
84
-
85
-
86
-
87
-
88
-
89
-
90
-
91
-
92
-
93
-
94
-
95
-
96
-
97
-
98
-
 99
99 -
 100
100 -
 101
101 -
 102
102 -
 103
103 -
 104
104 -
 105
105 -
 106
106 -
 107
107 -
 108
108 -
 109
109 -
 110
110 -
 111
111 -
 112
112 -
 113
113 -
 114
114 -
 115
115 -
 116
116 -
 117
117 -
 118
118 -
 119
119 -
120
-
121
-
122
-
123
-
124
-
125
-
126
-
127
-
128
-
129
-
130
-
131
-
132
-
133
-
134
-
135
-
136
-
137
-
138
-
139
-
140
-
141
-
142
-
143
-
144
-
145
-
146
-
147
-
148
-
149
-
150
-
151
-
152
-
153
-
154
-
155
-
156
-
157
-
158
-
159
-
160
-
161
-
162
-
163
-
164
-
165
-
166
-
167
-
168
-
169
-
170
-
171
-
172
 |
 |

99
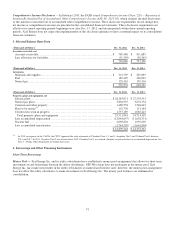
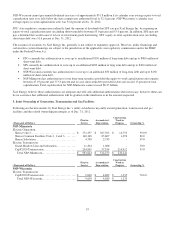
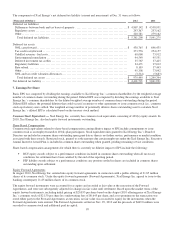
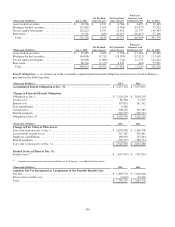
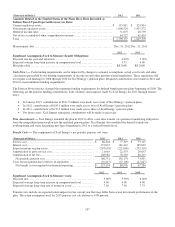
The components of Xcel Energy’s net deferred tax liability (current and noncurrent) at Dec. 31 were as follows:
(Thousands of Dollars)
2012
2011
Deferred tax liabilities:
Differences between book and tax bases of property ................................
..........
$
4,867,142
$
4,558,951
Regulatory assets ................................................................
..........
293,367
253,162
Other ................................................................
.....................
220,781
279,162
Total deferred tax liabilities ................................
...............................
$
5,381,290
$
5,091,275
Deferred tax assets:
NOL carryforward ................................................................
.........
$
430,765
$
696,435
Tax credit carryforward ................................................................
....
273,776
254,157
Unbilled revenue - fuel costs ................................
................................
60,068
73,912
Environmental remediation ................................................................
.
44,549
45,551
Deferred investment tax credits ................................
.............................
35,767
37,425
Regulatory liabilities ................................................................
.......
34,471
37,012
Rate refund................................................................
................
8,109
37,443
Other ................................................................
.....................
95,308
73,092
NOL and tax credit valuation allowances................................
.....................
(3,314)
(5,683)
Total deferred tax assets ................................................................
..
$
979,499
$
1,249,344
Net deferred tax liability ................................................................
.....
$
4,401,791
$
3,841,931
7. Earnings Per Share
Basic EPS was computed by dividing the earnings available to Xcel Energy Inc.’s common shareholders by the weighted average
number of common shares outstanding during the period. Diluted EPS was computed by dividing the earnings available to Xcel
Energy Inc.’s common shareholders by the diluted weighted average number of common shares outstanding during the period.
Diluted EPS reflects the potential dilution that could occur if securities or other agreements to issue common stock (i.e., common
stock equivalents) were settled. The weighted average number of potentially dilutive shares outstanding used to calculate Xcel
Energy Inc.’s diluted EPS is calculated based on the treasury stock method.
Common Stock Equivalents — Xcel Energy Inc. currently has common stock equivalents consisting of 401(k) equity awards. In
2010, Xcel Energy Inc. also had equity forward instruments outstanding.
Share-Based Compensation
Common stock equivalents related to share-based compensation causing dilutive impact to EPS include commitments to issue
common stock as an employer match to 401(k) plan participants. Stock equivalent units granted to Xcel Energy Inc.’s Board of
Directors are included in common shares outstanding upon grant date as there is no further service, performance or market condition
associated with these awards. Restricted stock, granted to settle amounts due certain employees under the Xcel Energy Inc. Executive
Annual Incentive Award Plan, is included in common shares outstanding when granted, pending remaining service conditions.
Share-based compensation arrangements for which there is currently no dilutive impact to EPS include the following:
• RSU equity awards subject to a performance condition; included in common shares outstanding when all necessary
conditions for settlement have been satisfied by the end of the reporting period.
• PSP liability awards subject to a performance condition; any portions settled in shares are included in common shares
outstanding upon settlement.
Equity Forward Agreements
In August 2010, Xcel Energy Inc. entered into equity forward agreements in connection with a public offering of 21.85 million
shares of its common stock. Under the equity forward agreements (Forward Agreements), Xcel Energy Inc. agreed to issue to the
banking counterparty 21.85 million shares of its common stock.
The equity forward instruments were accounted for as equity and recorded at fair value at the execution of the Forward
Agreements, and were not subsequently adjusted for changes in fair value until settlement. Based upon the market terms of the
equity forward instruments, including initial pricing of $20.855 per share based on the August 2010 offering price of Xcel Energy
Inc.’s common stock of $21.50 per share less underwriting fees of $0.645 per share, and as no premium on the transaction was
owed either party to the Forward Agreements at execution, no fair value was recorded to equity for the instruments when the
Forward Agreements were entered. The Forward Agreements settled on Nov. 29, 2010 and the proceeds of $449.8 million were
recorded to common stock and additional paid in capital.