Xcel Energy 2012 Annual Report Download - page 114
Download and view the complete annual report
Please find page 114 of the 2012 Xcel Energy annual report below. You can navigate through the pages in the report by either clicking on the pages listed below, or by using the keyword search tool below to find specific information within the annual report.-
 1
1 -
2
-
3
-
4
-
5
-
6
-
7
-
8
-
9
-
10
-
11
-
12
-
13
-
14
-
15
-
16
-
17
-
18
-
19
-
20
-
21
-
22
-
23
-
24
-
25
-
26
-
27
-
28
-
29
-
30
-
31
-
32
-
33
-
34
-
35
-
36
-
37
-
38
-
39
-
40
-
41
-
42
-
43
-
44
-
45
-
46
-
47
-
48
-
49
-
50
-
51
-
52
-
53
-
54
-
55
-
56
-
57
-
58
-
59
-
60
-
61
-
62
-
63
-
64
-
65
-
66
-
67
-
68
-
69
-
70
-
71
-
72
-
73
-
74
-
75
-
76
-
77
-
78
-
79
-
80
-
81
-
82
-
83
-
84
-
85
-
86
-
87
-
88
-
89
-
90
-
91
-
92
-
93
-
94
-
95
-
96
-
97
-
98
-
99
-
100
-
101
-
102
-
103
-
 104
104 -
 105
105 -
 106
106 -
 107
107 -
 108
108 -
 109
109 -
 110
110 -
 111
111 -
 112
112 -
 113
113 -
 114
114 -
 115
115 -
 116
116 -
 117
117 -
 118
118 -
 119
119 -
 120
120 -
 121
121 -
 122
122 -
 123
123 -
 124
124 -
125
-
126
-
127
-
128
-
129
-
130
-
131
-
132
-
133
-
134
-
135
-
136
-
137
-
138
-
139
-
140
-
141
-
142
-
143
-
144
-
145
-
146
-
147
-
148
-
149
-
150
-
151
-
152
-
153
-
154
-
155
-
156
-
157
-
158
-
159
-
160
-
161
-
162
-
163
-
164
-
165
-
166
-
167
-
168
-
169
-
170
-
171
-
172
 |
 |

104
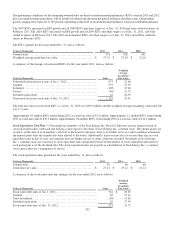
• PSCo had 2,011 bargaining employees covered under a collective-bargaining agreement, which expires in May
2014.
• SPS had 836 bargaining employees covered under a collective-bargaining agreement, which expires in October 2014.
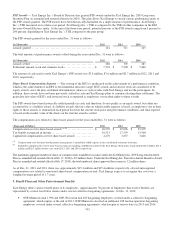
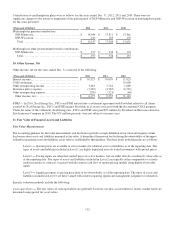
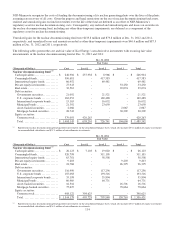
The plans invest in various instruments which are disclosed under the accounting guidance for fair value measurements which
establishes a hierarchical framework for disclosing the observability of the inputs utilized in measuring fair value. The three levels
in the hierarchy and examples of each level are as follows:
Level 1 — Quoted prices are available in active markets for identical assets as of the reporting date. The types of assets
included in Level 1 are highly liquid and actively traded instruments with quoted prices, such as common stocks listed
by the New York Stock Exchange.
Level 2 — Pricing inputs are other than quoted prices in active markets, but are either directly or indirectly observable as
of the reporting date. The types of assets included in Level 2 are typically either comparable to actively traded securities
or contracts, or priced with models using highly observable inputs, such as corporate bonds with pricing based on market
interest rate curves and recent trades of similarly rated securities.
Level 3 — Significant inputs to pricing have little or no observability as of the reporting date. The types of assets
included in Level 3 are those with inputs requiring significant management judgment or estimation.
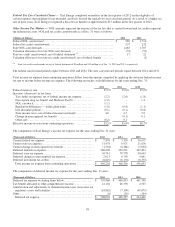
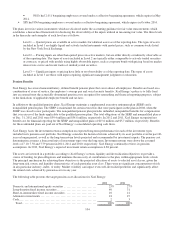
Pension Benefits
Xcel Energy has several noncontributory, defined benefit pension plans that cover almost all employees. Benefits are based on a
combination of years of service, the employee’s average pay and social security benefits. Xcel Energy’s policy is to fully fund
into an external trust the actuarially determined pension costs recognized for ratemaking and financial reporting purposes, subject
to the limitations of applicable employee benefit and tax laws.
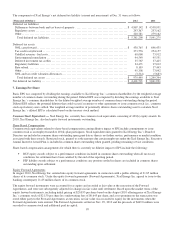
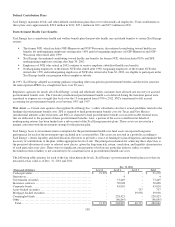
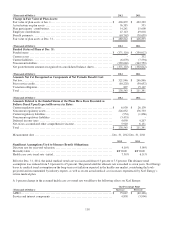
In addition to the qualified pension plans, Xcel Energy maintains a supplemental executive retirement plan (SERP) and a
nonqualified pension plan. The SERP is maintained for certain executives that were participants in the plan in 2008, when the
SERP was closed to new participants. The nonqualified pension plan provides unfunded, nonqualified benefits for compensation
that is in excess of the limits applicable to the qualified pension plans. The total obligations of the SERP and nonqualified plan as
of Dec. 31, 2012 and 2011 were $39.4 million and $54.8 million, respectively. In 2012 and 2011, Xcel Energy recognized net
benefit cost for financial reporting for the SERP and nonqualified plans of $15.6 million and $5.7 million, respectively. Benefits
for these unfunded plans are paid out of Xcel Energy’s consolidated operating cash flows.
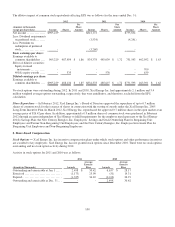
Xcel Energy bases the investment-return assumption on expected long-term performance for each of the investment types
included in its pension asset portfolio. Xcel Energy considers the historical returns achieved by its asset portfolio over the past 20-
year or longer period, as well as the long-term return levels projected and recommended by investment experts. The pension cost
determination assumes a forecasted mix of investment types over the long term. Investment returns were above the assumed
levels of 7.10, 7.50 and 7.79 percent in 2012, 2011 and 2010, respectively. Xcel Energy continually reviews its pension
assumptions. In 2013, Xcel Energy’s expected investment return assumption is 6.88 percent.
The assets are invested in a portfolio according to Xcel Energy’s return, liquidity and diversification objectives to provide a
source of funding for plan obligations and minimize the necessity of contributions to the plan, within appropriate levels of risk.
The principal mechanism for achieving these objectives is the projected allocation of assets to selected asset classes, given the
long-term risk, return, and liquidity characteristics of each particular asset class. There were no significant concentrations of risk
in any particular industry, index, or entity. Market volatility can impact even well-diversified portfolios and significantly affect
the return levels achieved by pension assets in any year.
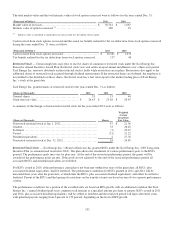
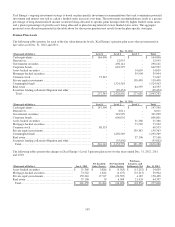
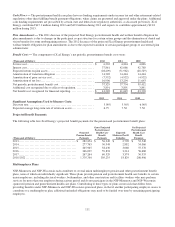
The following table presents the target pension asset allocations for Xcel Energy:
2012
2011
Domestic and international equity securities
..........................
25
%
27
%
Long-duration fixed income securities
................................
40
31
Short-to-intermediate fixed income securities
.........................
10
12
Alternative investments ................................
.............
23
27
Cash................................
...............................
2
3
Total ................................
............................
100
%
100
%