Xcel Energy 2012 Annual Report Download - page 67
Download and view the complete annual report
Please find page 67 of the 2012 Xcel Energy annual report below. You can navigate through the pages in the report by either clicking on the pages listed below, or by using the keyword search tool below to find specific information within the annual report.-
 1
1 -
2
-
3
-
4
-
5
-
6
-
7
-
8
-
9
-
10
-
11
-
12
-
13
-
14
-
15
-
16
-
17
-
18
-
19
-
20
-
21
-
22
-
23
-
24
-
25
-
26
-
27
-
28
-
29
-
30
-
31
-
32
-
33
-
34
-
35
-
36
-
37
-
38
-
39
-
40
-
41
-
42
-
43
-
44
-
45
-
46
-
47
-
48
-
49
-
50
-
51
-
52
-
53
-
54
-
55
-
56
-
 57
57 -
 58
58 -
 59
59 -
 60
60 -
 61
61 -
 62
62 -
 63
63 -
 64
64 -
 65
65 -
 66
66 -
 67
67 -
 68
68 -
 69
69 -
 70
70 -
 71
71 -
 72
72 -
 73
73 -
 74
74 -
 75
75 -
 76
76 -
 77
77 -
78
-
79
-
80
-
81
-
82
-
83
-
84
-
85
-
86
-
87
-
88
-
89
-
90
-
91
-
92
-
93
-
94
-
95
-
96
-
97
-
98
-
99
-
100
-
101
-
102
-
103
-
104
-
105
-
106
-
107
-
108
-
109
-
110
-
111
-
112
-
113
-
114
-
115
-
116
-
117
-
118
-
119
-
120
-
121
-
122
-
123
-
124
-
125
-
126
-
127
-
128
-
129
-
130
-
131
-
132
-
133
-
134
-
135
-
136
-
137
-
138
-
139
-
140
-
141
-
142
-
143
-
144
-
145
-
146
-
147
-
148
-
149
-
150
-
151
-
152
-
153
-
154
-
155
-
156
-
157
-
158
-
159
-
160
-
161
-
162
-
163
-
164
-
165
-
166
-
167
-
168
-
169
-
170
-
171
-
172
 |
 |

57
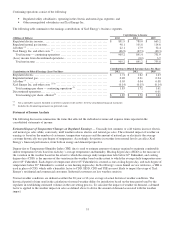
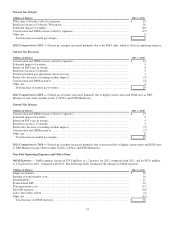
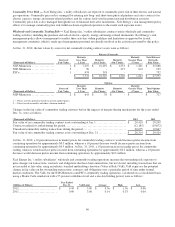
Natural Gas Margin
(Millions of Dollars)
2012 vs. 2011
PSIA rider (Colorado) offset by expenses ................................
........................
$
29
Retail rate increase (Colorado, Wisconsin)................................
.......................
16
Estimated impact of weather................................................................
....
(26
)
Conservation and DSM revenue (offset by expenses) ................................
.............
(17
)
Other, net ....................................................................................
6
Total increase in natural gas margin ................................
...........................
$
8
2012 Comparison to 2011 — Natural gas margins increased primarily due to the PSIA rider, which is offset in operating expense.
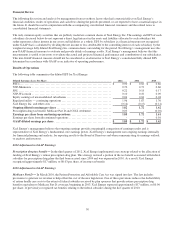
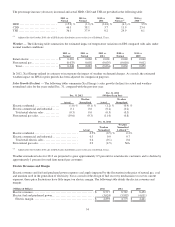
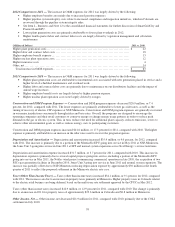
Natural Gas Revenues
(Millions of Dollars)
2011 vs. 2010
Conservation and DSM revenue (offset by expenses) ................................
.............
$
13
Estimated impact of weather...................................................................
9
Return on PSCo gas in storage .................................................................
4
Retail rate increase (Colorado) ................................................................
3
Purchased natural gas adjustment clause recovery ...............................................
3
Retail sales decrease (excluding weather impact) ................................
.................
(5
)
Conservation and DSM incentive ................................
...............................
(2
)
Other, net ....................................................................................
4
Total increase in natural gas revenues ................................
.........................
$
29
2011 Comparison to 2010 — Natural gas revenues increased primarily due to higher conservation and DSM rates at NSP-
Minnesota and colder weather in 2011 at PSCo and NSP-Minnesota.
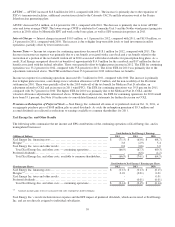
Natural Gas Margin
(Millions of Dollars)
2011 vs. 2010
Conservation and DSM revenue (offset by expenses) ................................
.............
$
13
Estimated impact of weather...................................................................
9
Return on PSCo gas in storage .................................................................
4
Retail rate increase (Colorado) ................................................................
3
Retail sales decrease (excluding weather impact) ................................
.................
(5
)
Conservation and DSM incentive ................................
...............................
(2
)
Other, net ....................................................................................
6
Total increase in natural gas margin ................................
...........................
$
28
2011 Comparison to 2010 — Natural gas margins increased primarily due to increased due to higher conservation and DSM rates
at NSP-Minnesota and colder weather in 2011 at PSCo and NSP-Minnesota.
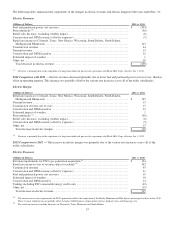
Non-Fuel Operating Expenses and Other Items
O&M Expenses — O&M expenses increased $35.8 million, or 1.7 percent, for 2012, compared with 2011, and by $83.0 million,
or 4.0 percent for 2011, compared with 2010. The following tables summarize the changes in O&M expenses:
(Millions of Dollars)
2012 vs. 2011
Employee benefits ................................................................
.............
$
36
Pipeline system integrity costs ................................................................
..
20
SmartGridCity ................................................................
................
11
Prairie Island EPU ................................................................
.............
10
Plant generation costs ................................................................
..........
(17
)
Bad debt expense ................................................................
..............
(10
)
Labor and contract labor ................................................................
.......
(2
)
Other, net ................................................................
.....................
(12
)
Total increase in O&M expenses................................
..............................
$
36