Xcel Energy 2012 Annual Report Download - page 62
Download and view the complete annual report
Please find page 62 of the 2012 Xcel Energy annual report below. You can navigate through the pages in the report by either clicking on the pages listed below, or by using the keyword search tool below to find specific information within the annual report.-
 1
1 -
2
-
3
-
4
-
5
-
6
-
7
-
8
-
9
-
10
-
11
-
12
-
13
-
14
-
15
-
16
-
17
-
18
-
19
-
20
-
21
-
22
-
23
-
24
-
25
-
26
-
27
-
28
-
29
-
30
-
31
-
32
-
33
-
34
-
35
-
36
-
37
-
38
-
39
-
40
-
41
-
42
-
43
-
44
-
45
-
46
-
47
-
48
-
49
-
50
-
51
-
 52
52 -
 53
53 -
 54
54 -
 55
55 -
 56
56 -
 57
57 -
 58
58 -
 59
59 -
 60
60 -
 61
61 -
 62
62 -
 63
63 -
 64
64 -
 65
65 -
 66
66 -
 67
67 -
 68
68 -
 69
69 -
 70
70 -
 71
71 -
 72
72 -
73
-
74
-
75
-
76
-
77
-
78
-
79
-
80
-
81
-
82
-
83
-
84
-
85
-
86
-
87
-
88
-
89
-
90
-
91
-
92
-
93
-
94
-
95
-
96
-
97
-
98
-
99
-
100
-
101
-
102
-
103
-
104
-
105
-
106
-
107
-
108
-
109
-
110
-
111
-
112
-
113
-
114
-
115
-
116
-
117
-
118
-
119
-
120
-
121
-
122
-
123
-
124
-
125
-
126
-
127
-
128
-
129
-
130
-
131
-
132
-
133
-
134
-
135
-
136
-
137
-
138
-
139
-
140
-
141
-
142
-
143
-
144
-
145
-
146
-
147
-
148
-
149
-
150
-
151
-
152
-
153
-
154
-
155
-
156
-
157
-
158
-
159
-
160
-
161
-
162
-
163
-
164
-
165
-
166
-
167
-
168
-
169
-
170
-
171
-
172
 |
 |

52
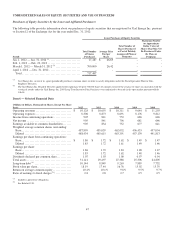
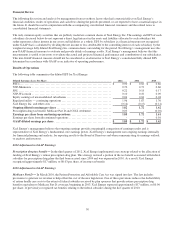
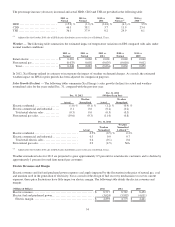
Changes in Diluted EPS
The following table summarizes significant components contributing to the changes in the diluted EPS compared with prior
periods, which are discussed in more detail later.
Diluted Earnings (Loss) Per Share Dec. 31
2011 GAAP and ongoing diluted earnings per share .................................
$ 1.72
Components of change — 2012 vs. 2011
Higher electric margins ............................................................
0.15
Lower effective tax rate ............................................................
0.04
Lower conservation and DSM expenses (generally offset in revenues) .................
0.03
Higher AFUDC - Equity ...........................................................
0.02
Higher natural gas margins .........................................................
0.01
Higher operating and maintenance expenses .........................................
(0.05)
Higher depreciation and amortization ...............................................
(0.04)
Higher taxes (other than income taxes) ..............................................
(0.04)
Higher interest charges.............................................................
(0.01)
Other, net (including interest and premium on redemption of preferred stock)...........
(0.01)
2012 ongoing diluted earnings per share.............................................
1.82
Prescription drug tax benefit..........................................................
0.03
2012 GAAP diluted earnings per share ..............................................
$ 1.85
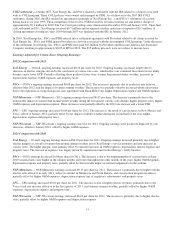
Diluted Earnings (Loss) Per Share Dec. 31
2010 GAAP diluted earnings per share ..............................................
$ 1.62
Earnings per share from discontinued operations .......................................
(0.01)
2010 diluted earnings per share from continuing operations .........................
1.61
Medicare Part D and COLI settlement .................................................
0.01
2010 ongoing diluted earnings per share.............................................
1.62
Components of change — 2011 vs. 2010
Higher electric margins ............................................................
0.44
Higher natural gas margins .........................................................
0.04
Higher operating and maintenance expenses .........................................
(0.11)
Dilution from DSPP, benefit plans and the 2010 common equity issuance ..............
(0.08)
Higher taxes (other than income taxes) ..............................................
(0.06)
Higher conservation and DSM expenses (generally offset in revenues) .................
(0.05)
Higher depreciation and amortization ...............................................
(0.04)
Other, net (including interest and premium on redemption of preferred stock)...........
(0.04)
2011 GAAP and ongoing diluted earnings per share .................................
$ 1.72
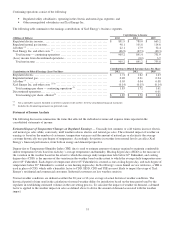
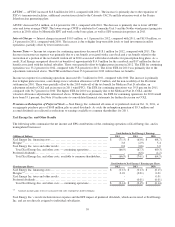
The following table provides a reconciliation of ongoing and GAAP earnings and earnings per diluted share for the years ended Dec. 31:
(Millions of Dollars)
2012
2011
2010
Ongoing earnings................................
............................
$
888.3
$
840.9
$
756.4
Prescription drug tax benefit, Medicare Part D and COLI settlement
..............
16.9
0.5
(4.5)
Total continuing operations ................................
..................
905.2
841.4
751.9
(Loss) income from discontinued operations ................................
....
-
(0.2)
3.9
GAAP earnings................................
..............................
$
905.2
$
841.2
$
755.8
Diluted Earnings (Loss) Per Share
2012
2011
2010
Ongoing diluted earnings per share (a) ................................
........
$
1.82
$
1.72
$
1.62
Prescription drug tax benefit, Medicare Part D and COLI settlement
..............
0.03
-
(0.01)
Earnings per share from continuing operations (a)
............................
1.85
1.72
1.61
Earnings per share from discontinued operations
................................
-
-
0.01
GAAP diluted earnings per share (a) ................................
..........
$
1.85
$
1.72
$
1.62
(a) Includes the dividend requirements on preferred stock.