Xcel Energy 2012 Annual Report Download - page 89
Download and view the complete annual report
Please find page 89 of the 2012 Xcel Energy annual report below. You can navigate through the pages in the report by either clicking on the pages listed below, or by using the keyword search tool below to find specific information within the annual report.-
 1
1 -
2
-
3
-
4
-
5
-
6
-
7
-
8
-
9
-
10
-
11
-
12
-
13
-
14
-
15
-
16
-
17
-
18
-
19
-
20
-
21
-
22
-
23
-
24
-
25
-
26
-
27
-
28
-
29
-
30
-
31
-
32
-
33
-
34
-
35
-
36
-
37
-
38
-
39
-
40
-
41
-
42
-
43
-
44
-
45
-
46
-
47
-
48
-
49
-
50
-
51
-
52
-
53
-
54
-
55
-
56
-
57
-
58
-
59
-
60
-
61
-
62
-
63
-
64
-
65
-
66
-
67
-
68
-
69
-
70
-
71
-
72
-
73
-
74
-
75
-
76
-
77
-
78
-
 79
79 -
 80
80 -
 81
81 -
 82
82 -
 83
83 -
 84
84 -
 85
85 -
 86
86 -
 87
87 -
 88
88 -
 89
89 -
 90
90 -
 91
91 -
 92
92 -
 93
93 -
 94
94 -
 95
95 -
 96
96 -
 97
97 -
 98
98 -
 99
99 -
100
-
101
-
102
-
103
-
104
-
105
-
106
-
107
-
108
-
109
-
110
-
111
-
112
-
113
-
114
-
115
-
116
-
117
-
118
-
119
-
120
-
121
-
122
-
123
-
124
-
125
-
126
-
127
-
128
-
129
-
130
-
131
-
132
-
133
-
134
-
135
-
136
-
137
-
138
-
139
-
140
-
141
-
142
-
143
-
144
-
145
-
146
-
147
-
148
-
149
-
150
-
151
-
152
-
153
-
154
-
155
-
156
-
157
-
158
-
159
-
160
-
161
-
162
-
163
-
164
-
165
-
166
-
167
-
168
-
169
-
170
-
171
-
172
 |
 |

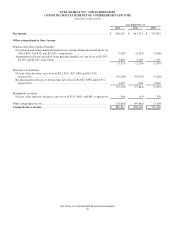
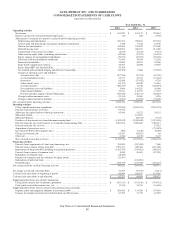
XCEL ENERGY INC. AND SUBSIDIARIES
CONSOLIDATED STATEMENTS OF COMPREHENSIVE INCOME
(amounts in thousands)
See Notes to Consolidated Financial Statements
79
Year Ended Dec. 31
2012
2011
2010
Net income .................................................................
$
905,229
$
841,172
$
755,834
Other comprehensive (loss) income
Pension and retiree medical benefits:
Net pension and retiree medical benefit losses arising during the period net of tax
of $(4,898), $(4,442) and $(2,647), respectively ............................
(7,005)
(6,367
)
(3,606)
Amortization of losses included in net periodic benefit cost, net of tax of $2,567,
$2,195 and $1,231, respectively ..........................................
3,694
3,162
1,751
(3,311)
(3,205
)
(1,855)
Derivative instruments:
Net fair value decrease, net of tax of $(12,593), $(25,086) and $(3,159),
respectively .............................................................
(19,200)
(38,292
)
(4,289)
Reclassification of losses to net income, net of tax of $2,687, $598 and $1,951,
respectively .............................................................
3,697
648
2,630
(15,503)
(37,644
)
(1,659)
Marketable securities:
Net fair value increase (decrease), net of tax of $135, $(63) and $89, respectively
196
(93
)
130
Other comprehensive loss ....................................................
(18,618)
(40,942
)
(3,384)
Comprehensive income .....................................................
$
886,611
$
800,230
$
752,450