Xcel Energy 2012 Annual Report Download - page 156
Download and view the complete annual report
Please find page 156 of the 2012 Xcel Energy annual report below. You can navigate through the pages in the report by either clicking on the pages listed below, or by using the keyword search tool below to find specific information within the annual report.-
 1
1 -
2
-
3
-
4
-
5
-
6
-
7
-
8
-
9
-
10
-
11
-
12
-
13
-
14
-
15
-
16
-
17
-
18
-
19
-
20
-
21
-
22
-
23
-
24
-
25
-
26
-
27
-
28
-
29
-
30
-
31
-
32
-
33
-
34
-
35
-
36
-
37
-
38
-
39
-
40
-
41
-
42
-
43
-
44
-
45
-
46
-
47
-
48
-
49
-
50
-
51
-
52
-
53
-
54
-
55
-
56
-
57
-
58
-
59
-
60
-
61
-
62
-
63
-
64
-
65
-
66
-
67
-
68
-
69
-
70
-
71
-
72
-
73
-
74
-
75
-
76
-
77
-
78
-
79
-
80
-
81
-
82
-
83
-
84
-
85
-
86
-
87
-
88
-
89
-
90
-
91
-
92
-
93
-
94
-
95
-
96
-
97
-
98
-
99
-
100
-
101
-
102
-
103
-
104
-
105
-
106
-
107
-
108
-
109
-
110
-
111
-
112
-
113
-
114
-
115
-
116
-
117
-
118
-
119
-
120
-
121
-
122
-
123
-
124
-
125
-
126
-
127
-
128
-
129
-
130
-
131
-
132
-
133
-
134
-
135
-
136
-
137
-
138
-
139
-
140
-
141
-
142
-
143
-
144
-
145
-
 146
146 -
 147
147 -
 148
148 -
 149
149 -
 150
150 -
 151
151 -
 152
152 -
 153
153 -
 154
154 -
 155
155 -
 156
156 -
 157
157 -
 158
158 -
 159
159 -
 160
160 -
 161
161 -
 162
162 -
 163
163 -
 164
164 -
 165
165 -
 166
166 -
167
-
168
-
169
-
170
-
171
-
172
 |
 |

146
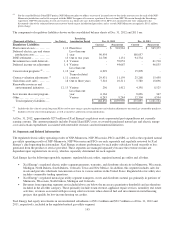
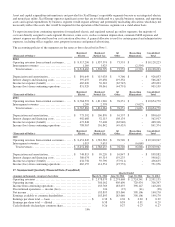
Asset and capital expenditure information is not provided for Xcel Energy’s reportable segments because as an integrated electric
and natural gas utility, Xcel Energy operates significant assets that are not dedicated to a specific business segment, and reporting
assets and capital expenditures by business segment would require arbitrary and potentially misleading allocations which may not
necessarily reflect the assets that would be required for the operation of the business segments on a stand-alone basis.
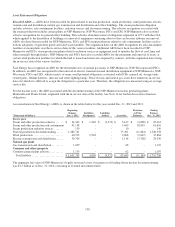
To report income from continuing operations for regulated electric and regulated natural gas utility segments, the majority of
costs are directly assigned to each segment. However, some costs, such as common depreciation, common O&M expenses and
interest expense are allocated based on cost causation allocators. A general allocator is used for certain general and administrative
expenses, including office supplies, rent, property insurance and general advertising.
The accounting policies of the segments are the same as those described in Note 1.
Regulated
Regulated
All
Reconciling
Consolidated
(Thousands of Dollars)
Electric
Natural Gas
Other
Eliminations
Total
2012
Operating revenues from external customers ...... $
8,517,296
$
1,537,374
$
73,553
$
-
$
10,128,223
Intersegment revenues ..........................
1,169
1,425
-
(2,594)
-
Total revenues ............................... $
8,518,465
$
1,538,799
$
73,553
$
(2,594)
$
10,128,223
Depreciation and amortization ................... $
801,649
$
115,038
$
9,366
$
-
$
926,053
Interest charges and financing costs ..............
397,457
49,456
119,354
-
566,267
Income tax expense (benefit) ....................
465,626
50,322
(65,745
)
-
450,203
Income (loss) from continuing operations.........
851,929
98,061
(44,791
)
-
905,199
Regulated
Regulated
All
Reconciling
Consolidated
(Thousands of Dollars)
Electric
Natural Gas
Other
Eliminations
Total
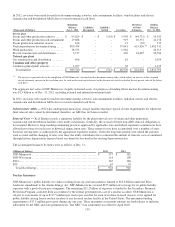
2011
Operating revenues from external customers ...... $
8,766,593
$
1,811,926
$
76,251
$
-
$
10,654,770
Intersegment revenues ..........................
1,269
2,358
-
(3,627)
-
Total revenues ............................... $
8,767,862
$
1,814,284
$
76,251
$
(3,627)
$
10,654,770
Depreciation and amortization ................... $
773,392
$
106,870
$
10,357
$
-
$
890,619
Interest charges and financing costs ..............
402,668
52,115
108,134
-
562,917
Income tax expense (benefit) ....................
473,848
57,408
(62,940
)
-
468,316
Income (loss) from continuing operations.........
788,967
101,842
(49,435
)
-
841,374
Regulated
Regulated
All
Reconciling
Consolidated
(Thousands of Dollars)
Electric
Natural Gas
Other
Eliminations
Total
2010
Operating revenues from external customers
.......
$
8,451,845
$
1,782,582
$
76,520
$
-
$
10,310,947
Intersegment revenues
...........................
1,015
5,653
-
(6,668)
-
Total revenues
................................
$
8,452,860
$
1,788,235
$
76,520
$
(6,668)
$
10,310,947
Depreciation and amortization
....................
$
748,815
$
99,220
$
10,847
$
-
$
858,882
Interest charges and financing costs
...............
380,074
49,314
119,233
-
548,621
Income tax expense (benefit)
.....................
434,756
59,790
(57,911
)
-
436,635
Income (loss) from continuing operations
..........
665,155
114,554
(27,753
)
-
751,956
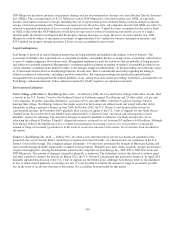
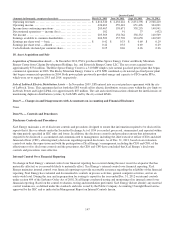
17. Summarized Quarterly Financial Data (Unaudited)
Quarter Ended
(Amounts in thousands, except per share data)
March 31, 2012
June 30, 2012
Sept. 30, 2012
Dec. 31, 2012
Operating revenues ................................
.............
$
2,578,079
$
2,274,668
$
2,724,341
$
2,551,135
Operating income................................
...............
380,162
405,690
720,434
316,397
Income from continuing operations
..............................
183,769
183,075
398,147
140,208
Discontinued operations — income (loss)
.........................
124
(15)
(41)
(38)
Net income ................................
....................
183,893
183,060
398,106
140,170
Earnings available to common shareholders
.......................
183,893
183,060
398,106
140,170
Earnings per share total — basic ................................
.
$
0.38
$
0.38
$
0.82
$
0.29
Earnings per share total — diluted
...............................
0.38
0.38
0.81
0.29
Cash dividends declared per common share
.......................
0.26
0.27
0.27
0.27