Xcel Energy 2012 Annual Report Download - page 167
Download and view the complete annual report
Please find page 167 of the 2012 Xcel Energy annual report below. You can navigate through the pages in the report by either clicking on the pages listed below, or by using the keyword search tool below to find specific information within the annual report.-
 1
1 -
2
-
3
-
4
-
5
-
6
-
7
-
8
-
9
-
10
-
11
-
12
-
13
-
14
-
15
-
16
-
17
-
18
-
19
-
20
-
21
-
22
-
23
-
24
-
25
-
26
-
27
-
28
-
29
-
30
-
31
-
32
-
33
-
34
-
35
-
36
-
37
-
38
-
39
-
40
-
41
-
42
-
43
-
44
-
45
-
46
-
47
-
48
-
49
-
50
-
51
-
52
-
53
-
54
-
55
-
56
-
57
-
58
-
59
-
60
-
61
-
62
-
63
-
64
-
65
-
66
-
67
-
68
-
69
-
70
-
71
-
72
-
73
-
74
-
75
-
76
-
77
-
78
-
79
-
80
-
81
-
82
-
83
-
84
-
85
-
86
-
87
-
88
-
89
-
90
-
91
-
92
-
93
-
94
-
95
-
96
-
97
-
98
-
99
-
100
-
101
-
102
-
103
-
104
-
105
-
106
-
107
-
108
-
109
-
110
-
111
-
112
-
113
-
114
-
115
-
116
-
117
-
118
-
119
-
120
-
121
-
122
-
123
-
124
-
125
-
126
-
127
-
128
-
129
-
130
-
131
-
132
-
133
-
134
-
135
-
136
-
137
-
138
-
139
-
140
-
141
-
142
-
143
-
144
-
145
-
146
-
147
-
148
-
149
-
150
-
151
-
152
-
153
-
154
-
155
-
156
-
 157
157 -
 158
158 -
 159
159 -
 160
160 -
 161
161 -
 162
162 -
 163
163 -
 164
164 -
 165
165 -
 166
166 -
 167
167 -
 168
168 -
 169
169 -
 170
170 -
 171
171 -
 172
172
 |
 |

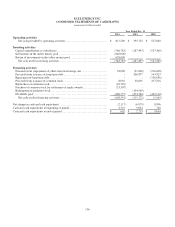
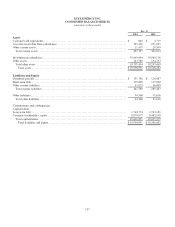
157
XCEL ENERGY INC.
CONDENSED BALANCE SHEETS
(amounts in thousands)
Dec. 31
2012
2011
Assets
Cash and cash equivalents ................................................................... $
602
$
2,719
Accounts receivable from subsidiaries ........................................................
195,438
271,895
Other current assets .........................................................................
11,497
28,399
Total current assets .......................................................................
207,537
303,013
Investment in subsidiaries ...................................................................
10,643,694
10,089,116
Other assets ................................................................................
143,760
154,353
Total other assets .........................................................................
10,787,454
10,243,469
Total assets ............................................................................ $
10,994,991
$
10,546,482
Liabilities and Equity
Dividends payable .......................................................................... $
131,748
$
126,487
Short-term debt.............................................................................
179,000
127,000
Other current liabilities......................................................................
31,032
36,000
Total current liabilities ....................................................................
341,780
289,487
Other liabilities.............................................................................
34,360
31,616
Total other liabilities......................................................................
34,360
31,616
Commitments and contingencies
Capitalization
Long-term debt.............................................................................
1,744,774
1,743,181
Common stockholders’ equity ...............................................................
8,874,077
8,482,198
Total capitalization .......................................................................
10,618,851
10,225,379
Total liabilities and equity............................................................... $
10,994,991
$
10,546,482