Xcel Energy 2012 Annual Report Download - page 88
Download and view the complete annual report
Please find page 88 of the 2012 Xcel Energy annual report below. You can navigate through the pages in the report by either clicking on the pages listed below, or by using the keyword search tool below to find specific information within the annual report.-
 1
1 -
2
-
3
-
4
-
5
-
6
-
7
-
8
-
9
-
10
-
11
-
12
-
13
-
14
-
15
-
16
-
17
-
18
-
19
-
20
-
21
-
22
-
23
-
24
-
25
-
26
-
27
-
28
-
29
-
30
-
31
-
32
-
33
-
34
-
35
-
36
-
37
-
38
-
39
-
40
-
41
-
42
-
43
-
44
-
45
-
46
-
47
-
48
-
49
-
50
-
51
-
52
-
53
-
54
-
55
-
56
-
57
-
58
-
59
-
60
-
61
-
62
-
63
-
64
-
65
-
66
-
67
-
68
-
69
-
70
-
71
-
72
-
73
-
74
-
75
-
76
-
77
-
 78
78 -
 79
79 -
 80
80 -
 81
81 -
 82
82 -
 83
83 -
 84
84 -
 85
85 -
 86
86 -
 87
87 -
 88
88 -
 89
89 -
 90
90 -
 91
91 -
 92
92 -
 93
93 -
 94
94 -
 95
95 -
 96
96 -
 97
97 -
 98
98 -
99
-
100
-
101
-
102
-
103
-
104
-
105
-
106
-
107
-
108
-
109
-
110
-
111
-
112
-
113
-
114
-
115
-
116
-
117
-
118
-
119
-
120
-
121
-
122
-
123
-
124
-
125
-
126
-
127
-
128
-
129
-
130
-
131
-
132
-
133
-
134
-
135
-
136
-
137
-
138
-
139
-
140
-
141
-
142
-
143
-
144
-
145
-
146
-
147
-
148
-
149
-
150
-
151
-
152
-
153
-
154
-
155
-
156
-
157
-
158
-
159
-
160
-
161
-
162
-
163
-
164
-
165
-
166
-
167
-
168
-
169
-
170
-
171
-
172
 |
 |

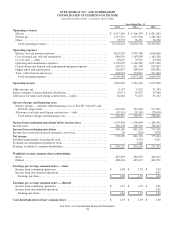
XCEL ENERGY INC. AND SUBSIDIARIES
CONSOLIDATED STATEMENTS OF INCOME
(amounts in thousands, except per share data)
See Notes to Consolidated Financial Statements
78
Year Ended Dec. 31
2012
2011
2010
Operating revenues
Electric ................................................................... $
8,517,296
$
8,766,593
$
8,451,845
Natural gas ...............................................................
1,537,374
1,811,926
1,782,582
Other .....................................................................
73,553
76,251
76,520
Total operating revenues .................................................
10,128,223
10,654,770
10,310,947
Operating expenses
Electric fuel and purchased power ..........................................
3,623,935
3,991,786
4,010,660
Cost of natural gas sold and transported .....................................
880,939
1,163,890
1,162,926
Cost of sales — other ......................................................
29,067
30,391
29,540
Operating and maintenance expenses........................................
2,176,095
2,140,289
2,057,249
Conservation and demand side management program expenses ................
260,527
281,378
239,827
Depreciation and amortization ..............................................
926,053
890,619
858,882
Taxes (other than income taxes) ............................................
408,924
374,815
331,894
Total operating expenses .................................................
8,305,540
8,873,168
8,690,978
Operating income ..........................................................
1,822,683
1,781,602
1,619,969
Other income, net............................................................
6,175
9,255
31,143
Equity earnings of unconsolidated subsidiaries .................................
29,971
30,527
29,948
Allowance for funds used during construction — equity ........................
62,840
51,223
56,152
Interest charges and financing costs
Interest charges — includes other financing costs of $24,087, $24,019, and
$20,638, respectively ....................................................
601,582
591,098
577,291
Allowance for funds used during construction — debt ........................
(35,315
)
(28,181)
(28,670)
Total interest charges and financing costs..................................
566,267
562,917
548,621
Income from continuing operations before income taxes .....................
1,355,402
1,309,690
1,188,591
Income taxes ................................................................
450,203
468,316
436,635
Income from continuing operations .........................................
905,199
841,374
751,956
Income (loss) from discontinued operations, net of tax ..........................
30
(202)
3,878
Net income .................................................................
905,229
841,172
755,834
Dividend requirements on preferred stock .....................................
-
3,534
4,241
Premium on redemption of preferred stock.....................................
-
3,260
-
Earnings available to common shareholders....................................
$
905,229
$
834,378
$
751,593
Weighted average common shares outstanding:
Basic .....................................................................
487,899
485,039
462,052
Diluted ...................................................................
488,434
485,615
463,391
Earnings per average common share — basic:
Income from continuing operations ......................................... $
1.86
$
1.72
$
1.62
Income from discontinued operations .......................................
-
-
0.01
Earnings per share .......................................................
$
1.86
$
1.72
$
1.63
Earnings per average common share — diluted:
Income from continuing operations ......................................... $
1.85
$
1.72
$
1.61
Income from discontinued operations .......................................
-
-
0.01
Earnings per share .......................................................
$
1.85
$
1.72
$
1.62
Cash dividends declared per common share ................................. $
1.07
$
1.03
$
1.00