Xcel Energy 2012 Annual Report Download - page 55
Download and view the complete annual report
Please find page 55 of the 2012 Xcel Energy annual report below. You can navigate through the pages in the report by either clicking on the pages listed below, or by using the keyword search tool below to find specific information within the annual report.-
 1
1 -
2
-
3
-
4
-
5
-
6
-
7
-
8
-
9
-
10
-
11
-
12
-
13
-
14
-
15
-
16
-
17
-
18
-
19
-
20
-
21
-
22
-
23
-
24
-
25
-
26
-
27
-
28
-
29
-
30
-
31
-
32
-
33
-
34
-
35
-
36
-
37
-
38
-
39
-
40
-
41
-
42
-
43
-
44
-
 45
45 -
 46
46 -
 47
47 -
 48
48 -
 49
49 -
 50
50 -
 51
51 -
 52
52 -
 53
53 -
 54
54 -
 55
55 -
 56
56 -
 57
57 -
 58
58 -
 59
59 -
 60
60 -
 61
61 -
 62
62 -
 63
63 -
 64
64 -
 65
65 -
66
-
67
-
68
-
69
-
70
-
71
-
72
-
73
-
74
-
75
-
76
-
77
-
78
-
79
-
80
-
81
-
82
-
83
-
84
-
85
-
86
-
87
-
88
-
89
-
90
-
91
-
92
-
93
-
94
-
95
-
96
-
97
-
98
-
99
-
100
-
101
-
102
-
103
-
104
-
105
-
106
-
107
-
108
-
109
-
110
-
111
-
112
-
113
-
114
-
115
-
116
-
117
-
118
-
119
-
120
-
121
-
122
-
123
-
124
-
125
-
126
-
127
-
128
-
129
-
130
-
131
-
132
-
133
-
134
-
135
-
136
-
137
-
138
-
139
-
140
-
141
-
142
-
143
-
144
-
145
-
146
-
147
-
148
-
149
-
150
-
151
-
152
-
153
-
154
-
155
-
156
-
157
-
158
-
159
-
160
-
161
-
162
-
163
-
164
-
165
-
166
-
167
-
168
-
169
-
170
-
171
-
172
 |
 |

45
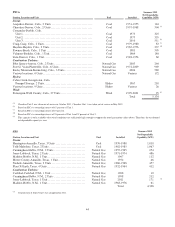
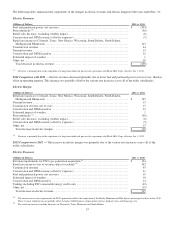
Electric utility overhead and underground transmission and distribution lines (measured in conductor miles) at Dec. 31, 2012:
Conductor Miles
NSP-Minnesota
NSP-Wisconsin
PSCo
SPS
500 KV ................................
.........
2,917
-
-
-
345 KV ................................
.........
6,388
1,152
1,614
6,805
230 KV ................................
.........
1,801
-
12,228
9,684
161 KV ................................
.........
281
1,568
-
-
138 KV ................................
.........
-
-
92
-
115 KV ................................
.........
7,129
1,737
4,923
11,479
Less than 115 KV
...............................
82,963
32,090
73,813
22,067
Electric utility transmission and distribution substations at Dec. 31, 2012:
NSP-Minnesota
NSP-Wisconsin
PSCo
SPS
Quantity ................................
........
349
204
230
426
Natural gas utility mains at Dec. 31, 2012:
Miles
NSP-Minnesota
NSP-Wisconsin
PSCo
WGI
Transmission................................
....
137
-
2,236
11
Distribution ................................
.....
9,732
2,243
21,542
-
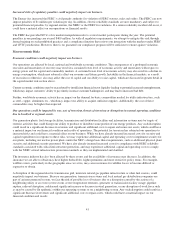
Item 3 — Legal Proceedings
In the normal course of business, various lawsuits and claims have arisen against Xcel Energy. Xcel Energy has recorded an
estimate of the probable cost of settlement or other disposition for such matters.
Additional Information
See Note 13 to the consolidated financial statements for further discussion of legal claims and environmental proceedings. See
Item 1, Item 7 and Note 12 to the consolidated financial statements for a discussion of proceedings involving utility rates and
other regulatory matters.
Item 4 — Mine Safety Disclosures
None.
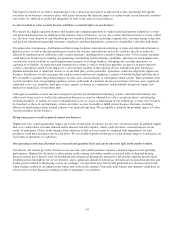
PART II
Item 5 — Market for Registrant’s Common Equity, Related Stockholder Matters and Issuer Purchases of Equity
Securities
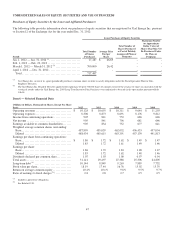
Quarterly Stock Data
Xcel Energy Inc.’s common stock is listed on the New York Stock Exchange (NYSE). The trading symbol is XEL. The number
of common shareholders of record as of Dec. 31, 2012 was approximately 73,414. The following are the reported high and low
sales prices based on the NYSE Composite Transactions for the quarters of 2012 and 2011 and the dividends declared per share
during those quarters.
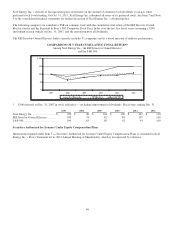
2012
High
Low
Dividends
First quarter .........................................
$
27.93
$
25.92
$
0.2600
Second quarter ......................................
29.12
25.89
0.2700
Third quarter ........................................
29.92
27.25
0.2700
Fourth quarter .......................................
28.34
25.84
0.2700
2011
High
Low
Dividends
First quarter .........................................
$
24.67
$
23.17
$
0.2525
Second quarter ......................................
25.39
23.38
0.2600
Third quarter ........................................
25.60
21.20
0.2600
Fourth quarter .......................................
27.78
23.48
0.2600