Xcel Energy 2012 Annual Report Download - page 78
Download and view the complete annual report
Please find page 78 of the 2012 Xcel Energy annual report below. You can navigate through the pages in the report by either clicking on the pages listed below, or by using the keyword search tool below to find specific information within the annual report.-
 1
1 -
2
-
3
-
4
-
5
-
6
-
7
-
8
-
9
-
10
-
11
-
12
-
13
-
14
-
15
-
16
-
17
-
18
-
19
-
20
-
21
-
22
-
23
-
24
-
25
-
26
-
27
-
28
-
29
-
30
-
31
-
32
-
33
-
34
-
35
-
36
-
37
-
38
-
39
-
40
-
41
-
42
-
43
-
44
-
45
-
46
-
47
-
48
-
49
-
50
-
51
-
52
-
53
-
54
-
55
-
56
-
57
-
58
-
59
-
60
-
61
-
62
-
63
-
64
-
65
-
66
-
67
-
 68
68 -
 69
69 -
 70
70 -
 71
71 -
 72
72 -
 73
73 -
 74
74 -
 75
75 -
 76
76 -
 77
77 -
 78
78 -
 79
79 -
 80
80 -
 81
81 -
 82
82 -
 83
83 -
 84
84 -
 85
85 -
 86
86 -
 87
87 -
 88
88 -
89
-
90
-
91
-
92
-
93
-
94
-
95
-
96
-
97
-
98
-
99
-
100
-
101
-
102
-
103
-
104
-
105
-
106
-
107
-
108
-
109
-
110
-
111
-
112
-
113
-
114
-
115
-
116
-
117
-
118
-
119
-
120
-
121
-
122
-
123
-
124
-
125
-
126
-
127
-
128
-
129
-
130
-
131
-
132
-
133
-
134
-
135
-
136
-
137
-
138
-
139
-
140
-
141
-
142
-
143
-
144
-
145
-
146
-
147
-
148
-
149
-
150
-
151
-
152
-
153
-
154
-
155
-
156
-
157
-
158
-
159
-
160
-
161
-
162
-
163
-
164
-
165
-
166
-
167
-
168
-
169
-
170
-
171
-
172
 |
 |

68
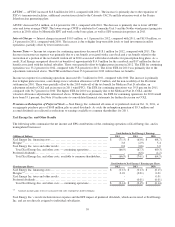
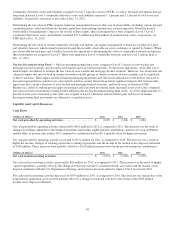
Commodity derivative assets and liabilities assigned to Level 3 typically consist of FTRs, as well as forwards and options that are
long-term in nature. Level 3 commodity derivative assets and liabilities represent 1.1 percent and 3.1 percent of total assets and
liabilities, respectively, measured at fair value at Dec. 31, 2012.
Determining the fair value of FTRs requires numerous management forecasts that vary in observability, including various forward
commodity prices, retail and wholesale demand, generation and resulting transmission system congestion. Given the limited
observability of management’s forecasts for several of these inputs, these instruments have been assigned a Level 3. Level 3
commodity derivatives assets and liabilities included $17.5 million and $0.8 million of estimated fair values, respectively, for
FTRs held at Dec. 31, 2012.
Determining the fair value of certain commodity forwards and options can require management to make use of subjective price
and volatility forecasts which extend to periods beyond those readily observable on active exchanges or quoted by brokers. When
less observable forward price and volatility forecasts are significant to determining the value of commodity forwards and options,
these instruments are assigned to Level 3. There were immaterial Level 3 commodity forwards and no Level 3 options held at
Dec. 31, 2012.
Nuclear Decommissioning Fund — Nuclear decommissioning fund assets assigned to Level 3 consist of asset-backed and
mortgage-backed securities, private equity investments and real estate investments. To the extent appropriate, observable active
market inputs are utilized to estimate the fair value of asset-backed and mortgage-backed securities. However, less observable and
subjective inputs that may be used in conjunction with available pricing of similar securities in active markets can be significant
to these valuations. These inputs include estimated principal prepayments and risk-based adjustments to the interest rate used to
discount expected future cash flows in a discounted cash flow model. Given the potential significant impacts that unobservable
inputs may have on the valuations of asset-backed and mortgage-backed securities, and based on an evaluation of NSP-
Minnesota’s ability to redeem private equity investments and real estate investment funds measured at net asset value, estimated
fair values for these investments totaling $104.6 million in the nuclear decommissioning fund at Dec. 31, 2012 (approximately 6.7
percent of total assets measured at fair value) are assigned to Level 3. Realized and unrealized gains and losses on nuclear
decommissioning fund investments are deferred as a regulatory asset.
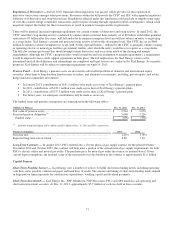
Liquidity and Capital Resources
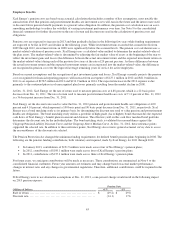
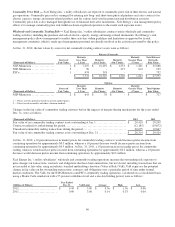
Cash Flows
(Millions of Dollars)
2012
2011
2010
Net cash provided by operating activities ........................ $
2,005
$
2,406
$
1,894
Net cash provided by operating activities decreased by $401 million for 2012 as compared to 2011. The decrease was the result of
changes in working capital due to the timing of payments and receipts, higher pension contributions, interest rate swap settlements
and the effect of income taxes paid in 2012 compared to a refund received in 2011, partially offset by higher net income.
Net cash provided by operating activities increased by $512 million for 2011 as compared to 2010. The increase was a result of
higher net income, changes in working capital due to timing of payments and the receipt of the nuclear waste disposal settlement
of $100 million. These increases were partially offset by a $103 million increase between the periods in pension contributions.
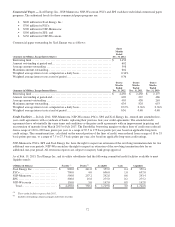
(Millions of Dollars)
2012
2011
2010
Net cash used in investing activities ............................. $
(2,333
)
$
(2,248
)
$
(2,807
)
Net cash used in investing activities increased by $85 million for 2012 as compared to 2011. The increase was the result of higher
capital expenditures, partially offset by the change in restricted cash due to customer refunds associated with the nuclear waste
disposal settlement with the U.S. Department of Energy and insurance proceeds related to Sherco Unit 3 received in 2012.
Net cash used in investing activities decreased by $559 million for 2011 as compared to 2010. The decrease was mainly due to the
acquisition of generation assets in 2010 partially offset by a change in restricted cash due to the receipt of the $100 million
nuclear waste disposal settlement.