Xcel Energy 2012 Annual Report Download - page 117
Download and view the complete annual report
Please find page 117 of the 2012 Xcel Energy annual report below. You can navigate through the pages in the report by either clicking on the pages listed below, or by using the keyword search tool below to find specific information within the annual report.-
 1
1 -
2
-
3
-
4
-
5
-
6
-
7
-
8
-
9
-
10
-
11
-
12
-
13
-
14
-
15
-
16
-
17
-
18
-
19
-
20
-
21
-
22
-
23
-
24
-
25
-
26
-
27
-
28
-
29
-
30
-
31
-
32
-
33
-
34
-
35
-
36
-
37
-
38
-
39
-
40
-
41
-
42
-
43
-
44
-
45
-
46
-
47
-
48
-
49
-
50
-
51
-
52
-
53
-
54
-
55
-
56
-
57
-
58
-
59
-
60
-
61
-
62
-
63
-
64
-
65
-
66
-
67
-
68
-
69
-
70
-
71
-
72
-
73
-
74
-
75
-
76
-
77
-
78
-
79
-
80
-
81
-
82
-
83
-
84
-
85
-
86
-
87
-
88
-
89
-
90
-
91
-
92
-
93
-
94
-
95
-
96
-
97
-
98
-
99
-
100
-
101
-
102
-
103
-
104
-
105
-
106
-
 107
107 -
 108
108 -
 109
109 -
 110
110 -
 111
111 -
 112
112 -
 113
113 -
 114
114 -
 115
115 -
 116
116 -
 117
117 -
 118
118 -
 119
119 -
 120
120 -
 121
121 -
 122
122 -
 123
123 -
 124
124 -
 125
125 -
 126
126 -
 127
127 -
128
-
129
-
130
-
131
-
132
-
133
-
134
-
135
-
136
-
137
-
138
-
139
-
140
-
141
-
142
-
143
-
144
-
145
-
146
-
147
-
148
-
149
-
150
-
151
-
152
-
153
-
154
-
155
-
156
-
157
-
158
-
159
-
160
-
161
-
162
-
163
-
164
-
165
-
166
-
167
-
168
-
169
-
170
-
171
-
172
 |
 |

107
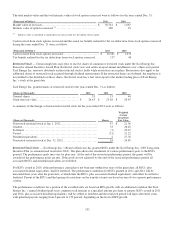
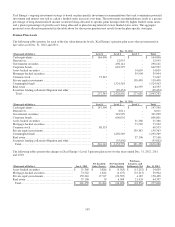
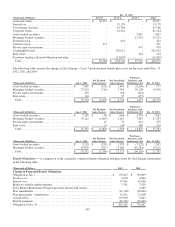
(Thousands of Dollars)
2012
2011
Amounts Related to the Funded Status of the Plans Have Been Recorded as
Follows Based Upon Expected Recovery in Rates:
Current regulatory assets ................................
.........................
$
115,811
$
123,814
Noncurrent regulatory assets................................
......................
1,606,524
1,435,372
Deferred income taxes ................................
...........................
31,075
28,759
Net-of-tax accumulated other comprehensive income
...............................
44,727
41,433
Total ................................................................
...........
$
1,798,137
$
1,629,378
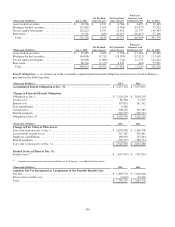
Measurement date ................................
..............................
Dec. 31, 2012
Dec. 31, 2011
2012
2011
Significant Assumptions Used to Measure Benefit Obligations:
Discount rate for year-end valuation................................
...............
4.00
%
5.00
%
Expected average long-term increase in compensation level
.........................
3.75
4.00
Mortality table ................................................................
..
RP 2000 RP 2000
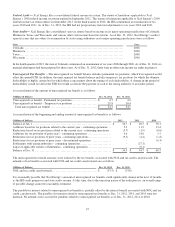
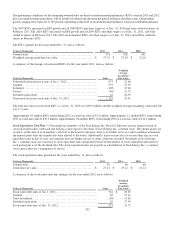
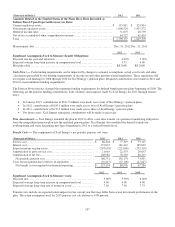
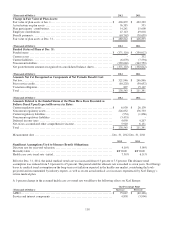
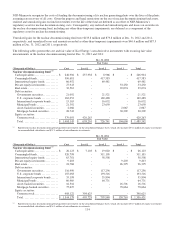
Cash Flows — Cash funding requirements can be impacted by changes to actuarial assumptions, actual asset levels and other
calculations prescribed by the funding requirements of income tax and other pension-related regulations. These regulations did
not require cash funding for 2008 through 2010 for Xcel Energy’s pension plans. Required contributions were made in 2011 and
2012 to meet minimum funding requirements.
The Pension Protection Act changed the minimum funding requirements for defined benefit pension plans beginning in 2008. The
following are the pension funding contributions, both voluntary and required, made by Xcel Energy for 2011 through January
2013:
• In January 2013, contributions of $191.5 million were made across four of Xcel Energy’s pension plans;
• In 2012, contributions of $198.1 million were made across four of Xcel Energy’s pension plans;
• In 2011, contributions of $137.3 million were made across three of Xcel Energy’s pension plans;
• For future years, Xcel Energy anticipates contributions will be made as necessary.
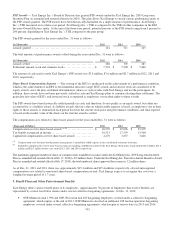
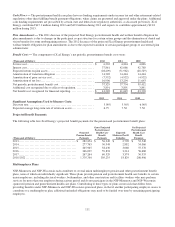
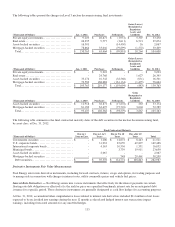
Plan Amendments — Xcel Energy amended the plan in 2012 to allow a one time transfer of a portion of qualifying obligations
from the nonqualified pension plan into the qualified pension plans. Xcel Energy also modified the benefit formula for
nonbargaining and some bargaining new hires beginning in 2012 to a reduced benefit level.
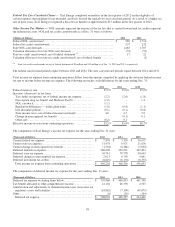
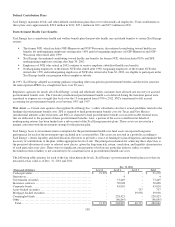
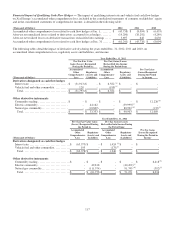
Benefit Costs — The components of Xcel Energy’s net periodic pension cost were:
(Thousands of Dollars)
2012
2011
2010
Service cost ................................
......................
$
86,364
$
77,319
$
73,147
Interest cost ................................
......................
157,035
161,412
165,010
Expected return on plan assets ................................
.....
(207,095
)
(221,600
)
(232,318
)
Amortization of prior service cost ................................
..
21,065
22,533
20,657
Amortization of net loss................................
...........
108,982
78,510
48,315
Net periodic pension cost................................
........
166,351
118,174
74,811
Costs not recognized due to effects of regulation
....................
(39,217
)
(37,198
)
(27,027
)
Net benefit cost recognized for financial reporting
.................
$
127,134
$
80,976
$
47,784
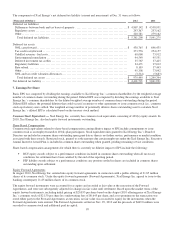
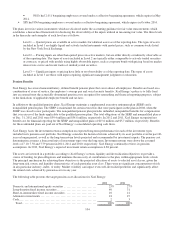
2012
2011
2010
Significant Assumptions Used to Measure Costs:
Discount rate ................................
.....................
5.00
%
5.50
%
6.00
%
Expected average long-term increase in compensation level
..........
4.00
4.00
4.00
Expected average long-term rate of return on assets
..................
7.10
7.50
7.79
Pension costs include an expected return impact for the current year that may differ from actual investment performance in the
plan. The return assumption used for 2013 pension cost calculations is 6.88 percent.