Xcel Energy 2012 Annual Report Download - page 2
Download and view the complete annual report
Please find page 2 of the 2012 Xcel Energy annual report below. You can navigate through the pages in the report by either clicking on the pages listed below, or by using the keyword search tool below to find specific information within the annual report.-
 1
1 -
 2
2 -
 3
3 -
 4
4 -
 5
5 -
 6
6 -
 7
7 -
 8
8 -
 9
9 -
 10
10 -
 11
11 -
 12
12 -
 13
13 -
14
-
15
-
16
-
17
-
18
-
19
-
20
-
21
-
22
-
23
-
24
-
25
-
26
-
27
-
28
-
29
-
30
-
31
-
32
-
33
-
34
-
35
-
36
-
37
-
38
-
39
-
40
-
41
-
42
-
43
-
44
-
45
-
46
-
47
-
48
-
49
-
50
-
51
-
52
-
53
-
54
-
55
-
56
-
57
-
58
-
59
-
60
-
61
-
62
-
63
-
64
-
65
-
66
-
67
-
68
-
69
-
70
-
71
-
72
-
73
-
74
-
75
-
76
-
77
-
78
-
79
-
80
-
81
-
82
-
83
-
84
-
85
-
86
-
87
-
88
-
89
-
90
-
91
-
92
-
93
-
94
-
95
-
96
-
97
-
98
-
99
-
100
-
101
-
102
-
103
-
104
-
105
-
106
-
107
-
108
-
109
-
110
-
111
-
112
-
113
-
114
-
115
-
116
-
117
-
118
-
119
-
120
-
121
-
122
-
123
-
124
-
125
-
126
-
127
-
128
-
129
-
130
-
131
-
132
-
133
-
134
-
135
-
136
-
137
-
138
-
139
-
140
-
141
-
142
-
143
-
144
-
145
-
146
-
147
-
148
-
149
-
150
-
151
-
152
-
153
-
154
-
155
-
156
-
157
-
158
-
159
-
160
-
161
-
162
-
163
-
164
-
165
-
166
-
167
-
168
-
169
-
170
-
171
-
172
 |
 |

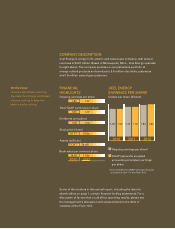
COMPANY DESCRIPTION
Xcel Energy is a major U.S. electric and natural gas company, with annual
revenues of $10.1 billion. Based in Minneapolis, Minn., Xcel Energy operates
in eight states. The company provides a comprehensive portfolio of
energy-related products and services to 3.4 million electricity customers
and 1.9 million natural gas customers.
Some of the sections in this annual report, including the letter to
shareholders on page 1, contain forward-looking statements. For a
discussion of factors that could affect operating results, please see
the management’s discussion and analysis listed in the table of
contents of the Form 10-K.
On the Cover:
Lineman Kjell Placek is among
the many Xcel Energy employees
who are working to keep the
electric system strong.
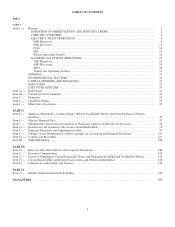
Ongoing earnings per share*
GAAP (generally accepted
accounting principles) earnings
per share
* A reconciliation to GAAP earnings per share
is located in Item 7 of the Form 10-K.
2012 2011
20112011
FINANCIAL
HIGHLIGHTS
Ongoing earnings per share
1.82 1.72
Total GAAP earnings per share
1.85 1.72
Dividends annualized
1.08 1.04
Stock price (close)
26.71 27.6 4
Assets (millions)
31,141 29,497
Book value per common share
18.19 17.44
2010 2011 2012
XCEL ENERGY
EARNINGS PER SHARE
Dollars per share (diluted)
1.62 1.72 1.821.62 1.72 1.85