Xcel Energy 2012 Annual Report Download - page 105
Download and view the complete annual report
Please find page 105 of the 2012 Xcel Energy annual report below. You can navigate through the pages in the report by either clicking on the pages listed below, or by using the keyword search tool below to find specific information within the annual report.-
 1
1 -
2
-
3
-
4
-
5
-
6
-
7
-
8
-
9
-
10
-
11
-
12
-
13
-
14
-
15
-
16
-
17
-
18
-
19
-
20
-
21
-
22
-
23
-
24
-
25
-
26
-
27
-
28
-
29
-
30
-
31
-
32
-
33
-
34
-
35
-
36
-
37
-
38
-
39
-
40
-
41
-
42
-
43
-
44
-
45
-
46
-
47
-
48
-
49
-
50
-
51
-
52
-
53
-
54
-
55
-
56
-
57
-
58
-
59
-
60
-
61
-
62
-
63
-
64
-
65
-
66
-
67
-
68
-
69
-
70
-
71
-
72
-
73
-
74
-
75
-
76
-
77
-
78
-
79
-
80
-
81
-
82
-
83
-
84
-
85
-
86
-
87
-
88
-
89
-
90
-
91
-
92
-
93
-
94
-
 95
95 -
 96
96 -
 97
97 -
 98
98 -
 99
99 -
 100
100 -
 101
101 -
 102
102 -
 103
103 -
 104
104 -
 105
105 -
 106
106 -
 107
107 -
 108
108 -
 109
109 -
 110
110 -
 111
111 -
 112
112 -
 113
113 -
 114
114 -
 115
115 -
116
-
117
-
118
-
119
-
120
-
121
-
122
-
123
-
124
-
125
-
126
-
127
-
128
-
129
-
130
-
131
-
132
-
133
-
134
-
135
-
136
-
137
-
138
-
139
-
140
-
141
-
142
-
143
-
144
-
145
-
146
-
147
-
148
-
149
-
150
-
151
-
152
-
153
-
154
-
155
-
156
-
157
-
158
-
159
-
160
-
161
-
162
-
163
-
164
-
165
-
166
-
167
-
168
-
169
-
170
-
171
-
172
 |
 |

95
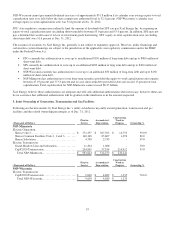
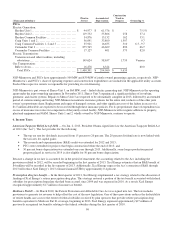
NSP-Wisconsin cannot pay annual dividends in excess of approximately $31.8 million if its calendar year average equity-to-total
capitalization ratio is or falls below the state commission authorized level of 52.5 percent. NSP-Wisconsin’s calendar year
average equity-to-total capitalization ratio was 52.6 percent at Dec. 31, 2012.
SPS’ state regulatory commissions indirectly limit the amount of dividends that SPS can pay Xcel Energy Inc. by requiring an
equity-to-total capitalization ratio (excluding short-term debt) between 45.0 percent and 55.0 percent. In addition, SPS may not
pay a dividend that would cause it to lose its investment grade bond rating. SPS’ equity-to-total capitalization ratio (excluding
short-term debt) was 51.6 percent at Dec. 31, 2012.
The issuance of securities by Xcel Energy Inc. generally is not subject to regulatory approval. However, utility financings and
certain intra-system financings are subject to the jurisdiction of the applicable state regulatory commissions and/or the FERC
under the Federal Power Act.
• PSCo currently has authorization to issue up to an additional $350 million of long-term debt and up to $800 million of
short-term debt.
• SPS currently has authorization to issue up to an additional $200 million of long term debt and up to $400 million of
short-term debt.
• NSP-Wisconsin currently has authorization to issue up to an additional $50 million of long-term debt and up to $150
million of short-term debt.
• NSP-Minnesota has authorization to issue long-term securities provided the equity-to-total capitalization ratio remains
between 47.07 percent and 57.53 percent and to issue short-term debt provided it does not exceed 15 percent of total
capitalization. Total capitalization for NSP-Minnesota cannot exceed $8.25 billion.
Xcel Energy believes these authorizations are adequate and will seek additional authorization when necessary; however, there can
be no assurance that additional authorization will be granted on the timeframe or in the amounts requested.
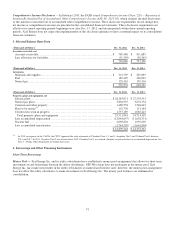
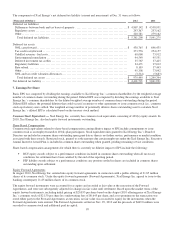
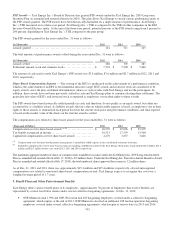
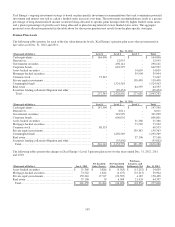
5. Joint Ownership of Generation, Transmission and Gas Facilities
Following are the investments by Xcel Energy Inc.’s utility subsidiaries in jointly owned generation, transmission and gas
facilities and the related ownership percentages as of Dec. 31, 2012:
Construction
Plant in
Accumulated
Work in
(Thousands of Dollars)
Service
Depreciation
Progress
Ownership %
NSP-Minnesota
Electric Generation:
Sherco Unit 3................................
.....
$ 572,357
$ 367,703
$ 14,753
59.0%
Sherco Common Facilities Units 1, 2 and 3
..........
140,368
85,607
1,076
80.0
Sherco Substation ................................
.
4,790
2,743
-
59.0
Electric Transmission:
Grand Meadow Line and Substation
................
11,204
1,086
-
50.0
CapX2020 Transmission
..........................
254,905
57,334
214,412
55.0
Total NSP-Minnesota
............................
$ 983,624
$ 514,473
$ 230,241
Construction
Plant in
Accumulated
Work in
(Thousands of Dollars)
Service
Depreciation
Progress
Ownership %
NSP-Wisconsin
Electric Transmission:
CapX2020 Transmission
..........................
$ 9,630
$ 4,689
$ 1,235
76.6%
Total NSP-Wisconsin
............................
$ 9,630
$ 4,689
$ 1,235