Xcel Energy 2012 Annual Report Download - page 84
Download and view the complete annual report
Please find page 84 of the 2012 Xcel Energy annual report below. You can navigate through the pages in the report by either clicking on the pages listed below, or by using the keyword search tool below to find specific information within the annual report.-
 1
1 -
2
-
3
-
4
-
5
-
6
-
7
-
8
-
9
-
10
-
11
-
12
-
13
-
14
-
15
-
16
-
17
-
18
-
19
-
20
-
21
-
22
-
23
-
24
-
25
-
26
-
27
-
28
-
29
-
30
-
31
-
32
-
33
-
34
-
35
-
36
-
37
-
38
-
39
-
40
-
41
-
42
-
43
-
44
-
45
-
46
-
47
-
48
-
49
-
50
-
51
-
52
-
53
-
54
-
55
-
56
-
57
-
58
-
59
-
60
-
61
-
62
-
63
-
64
-
65
-
66
-
67
-
68
-
69
-
70
-
71
-
72
-
73
-
 74
74 -
 75
75 -
 76
76 -
 77
77 -
 78
78 -
 79
79 -
 80
80 -
 81
81 -
 82
82 -
 83
83 -
 84
84 -
 85
85 -
 86
86 -
 87
87 -
 88
88 -
 89
89 -
 90
90 -
 91
91 -
 92
92 -
 93
93 -
 94
94 -
95
-
96
-
97
-
98
-
99
-
100
-
101
-
102
-
103
-
104
-
105
-
106
-
107
-
108
-
109
-
110
-
111
-
112
-
113
-
114
-
115
-
116
-
117
-
118
-
119
-
120
-
121
-
122
-
123
-
124
-
125
-
126
-
127
-
128
-
129
-
130
-
131
-
132
-
133
-
134
-
135
-
136
-
137
-
138
-
139
-
140
-
141
-
142
-
143
-
144
-
145
-
146
-
147
-
148
-
149
-
150
-
151
-
152
-
153
-
154
-
155
-
156
-
157
-
158
-
159
-
160
-
161
-
162
-
163
-
164
-
165
-
166
-
167
-
168
-
169
-
170
-
171
-
172
 |
 |
74
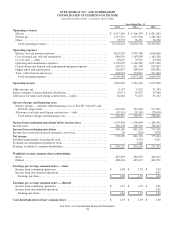
Financing Plans — Xcel Energy issues debt and equity securities to refinance retiring maturities, reduce short-term debt, fund
construction programs, infuse equity in subsidiaries, fund asset acquisitions and for other general corporate purposes.
During 2013, Xcel Energy Inc. and its utility subsidiaries anticipate issuing the following:
• NSP-Minnesota may issue approximately $400 million of first mortgage bonds in the first half of 2013.
• PSCo may issue approximately $500 million of first mortgage bonds in the first half of 2013.
• SPS may issue approximately $100 million of first mortgage bonds in the first half of 2013.
Financing plans are subject to change, depending on capital expenditures, internal cash generation, market conditions and other
factors.
Credit Ratings — Access to reasonably priced capital markets is dependent in part on credit and ratings. In 2011, Moody’s placed
SPS on negative outlook. On Oct. 8, 2012, Moody's downgraded SPS by one notch, based on the expected moderation of SPS’
credit metrics due to high levels of capital expenditures and regulatory lag. The outlook is now stable.
Off-Balance-Sheet Arrangements
Xcel Energy does not have any off-balance-sheet arrangements, other than those currently disclosed, that have or are reasonably
likely to have a current or future effect on financial condition, changes in financial condition, revenues or expenses, results of
operations, liquidity, capital expenditures or capital resources that is material to investors.
Earnings Guidance
Xcel Energy’s 2013 earnings guidance is $1.85 to $1.95 per share. Key assumptions related to 2013 earnings are detailed below:
• Constructive outcomes in all rate case and regulatory proceedings.
• Normal weather patterns are experienced for the year.
• Weather-adjusted retail electric utility sales are projected to grow approximately 0.5 percent.
• Weather-adjusted retail firm natural gas sales are projected to decline by approximately 1 percent.
• Rider revenue recovery for certain projects have been rolled into base rates, therefore the change is no longer
meaningful.
• O&M expenses are projected to increase approximately 4 percent to 5 percent over 2012 levels.
• Depreciation expense is projected to increase $75 million to $85 million over 2012 levels.
• Property taxes are projected to increase approximately $35 million to $40 million over 2012 levels.
• Interest expense (net of AFUDC— debt) is projected to decrease $30 million to $35 million from 2012 levels.
• AFUDC— equity is projected to increase approximately $15 million to $20 million over 2012 levels.
• The ETR is projected to be approximately 34 percent to 36 percent.
• Average common stock and equivalents are projected to be approximately 490 million to 500 million shares.
Item 7A — Quantitative and Qualitative Disclosures About Market Risk
See Item 7, incorporated by reference.
Item 8 — Financial Statements and Supplementary Data
See Item 15-1 for an index of financial statements included herein.
See Note 17 to the consolidated financial statements for summarized quarterly financial data.