Xcel Energy 2012 Annual Report Download - page 125
Download and view the complete annual report
Please find page 125 of the 2012 Xcel Energy annual report below. You can navigate through the pages in the report by either clicking on the pages listed below, or by using the keyword search tool below to find specific information within the annual report.-
 1
1 -
2
-
3
-
4
-
5
-
6
-
7
-
8
-
9
-
10
-
11
-
12
-
13
-
14
-
15
-
16
-
17
-
18
-
19
-
20
-
21
-
22
-
23
-
24
-
25
-
26
-
27
-
28
-
29
-
30
-
31
-
32
-
33
-
34
-
35
-
36
-
37
-
38
-
39
-
40
-
41
-
42
-
43
-
44
-
45
-
46
-
47
-
48
-
49
-
50
-
51
-
52
-
53
-
54
-
55
-
56
-
57
-
58
-
59
-
60
-
61
-
62
-
63
-
64
-
65
-
66
-
67
-
68
-
69
-
70
-
71
-
72
-
73
-
74
-
75
-
76
-
77
-
78
-
79
-
80
-
81
-
82
-
83
-
84
-
85
-
86
-
87
-
88
-
89
-
90
-
91
-
92
-
93
-
94
-
95
-
96
-
97
-
98
-
99
-
100
-
101
-
102
-
103
-
104
-
105
-
106
-
107
-
108
-
109
-
110
-
111
-
112
-
113
-
114
-
 115
115 -
 116
116 -
 117
117 -
 118
118 -
 119
119 -
 120
120 -
 121
121 -
 122
122 -
 123
123 -
 124
124 -
 125
125 -
 126
126 -
 127
127 -
 128
128 -
 129
129 -
 130
130 -
 131
131 -
 132
132 -
 133
133 -
 134
134 -
 135
135 -
136
-
137
-
138
-
139
-
140
-
141
-
142
-
143
-
144
-
145
-
146
-
147
-
148
-
149
-
150
-
151
-
152
-
153
-
154
-
155
-
156
-
157
-
158
-
159
-
160
-
161
-
162
-
163
-
164
-
165
-
166
-
167
-
168
-
169
-
170
-
171
-
172
 |
 |

115
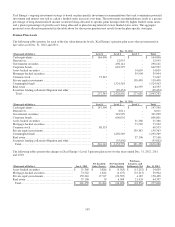
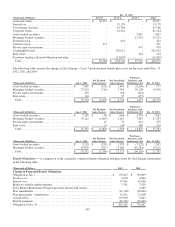
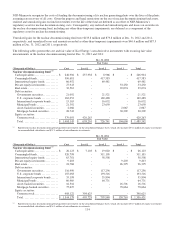
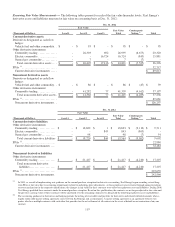
The following tables present the changes in Level 3 nuclear decommissioning fund investments:
(Thousands of Dollars)
Jan. 1, 2012
Purchases
Settlements
Gains (Losses)
Recognized as
Regulatory
Assets and
Liabilities
Dec. 31, 2012
Private equity investments.......................
$
9,203
$
20,671
$
(1,931
)
$
5,307
$
33,250
Real estate .....................................
26,395
9,777
(3,611
)
6,513
39,074
Asset-backed securities .........................
16,501
-
(14,450
)
16
2,067
Mortgage-backed securities......................
78,664
33,016
(79,899
)
(1,572)
30,209
Total.........................................
$
130,763
$
63,464
$
(99,891
)
$
10,264
$
104,600
(Thousands of Dollars)
Jan. 1, 2011
Purchases
Settlements
Gains (Losses)
Recognized as
Regulatory
Assets and
Liabilities
Dec. 31, 2011
Private equity investments.......................
$
-
$
9,203
$
-
$
-
$
9,203
Real estate .....................................
-
24,768
-
1,627
26,395
Asset-backed securities .........................
33,174
16,518
(32,560
)
(631)
16,501
Mortgage-backed securities......................
72,589
168,688
(161,134
)
(1,479)
78,664
Total.........................................
$
105,763
$
219,177
$
(193,694
)
$
(483)
$
130,763
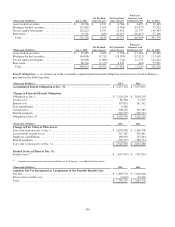
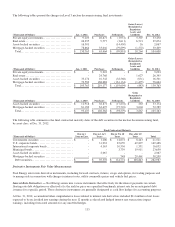
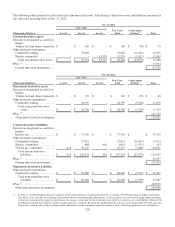
(Thousands of Dollars)
Jan. 1, 2010
Purchases
Settlements
Gains
Recognized as
Regulatory
Liabilities
Dec. 31, 2010
Asset-backed securities .........................
$
11,918
$
38,871
$
(17,878
)
$
263
$
33,174
Mortgage-backed securities......................
81,189
63,497
(75,70
1
)
3,604
72,589
Total.........................................
$
93,107
$
102,368
$
(93,579
)
$
3,867
$
105,763
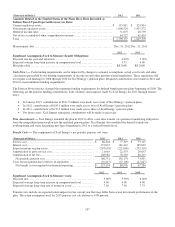
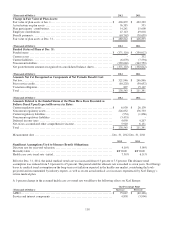
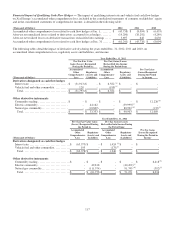
The following table summarizes the final contractual maturity dates of the debt securities in the nuclear decommissioning fund,
by asset class, at Dec. 31, 2012:
Final Contractual Maturity
(Thousands of Dollars)
Due in 1
Year or Less
Due in 1 to 5
Years
Due in 5 to 10
Years
Due after 10
Years
Total
Government securities
...........................
$
-
$
1,206
$
12,072
$
8,243
$
21,521
U.S. corporate bonds
.............................
-
31,932
87,659
49,897
169,488
International corporate bonds
.....................
-
4,165
10,556
1,331
16,052
Municipal bonds................................
.
-
-
3,739
19,911
23,650
Asset-backed securities
..........................
-
2,067
-
-
2,067
Mortgage-backed securities
.......................
-
-
748
29,461
30,209
Debt securities................................
.
$
-
$
39,370
$
114,774
$
108,843
$
262,987
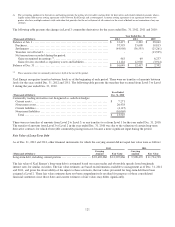
Derivative Instruments Fair Value Measurements
Xcel Energy enters into derivative instruments, including forward contracts, futures, swaps and options, for trading purposes and
to manage risk in connection with changes in interest rates, utility commodity prices and vehicle fuel prices.
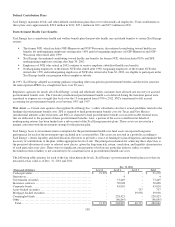
Interest Rate Derivatives — Xcel Energy enters into various instruments that effectively fix the interest payments on certain
floating rate debt obligations or effectively fix the yield or price on a specified benchmark interest rate for an anticipated debt
issuance for a specific period. These derivative instruments are generally designated as cash flow hedges for accounting purposes.
At Dec. 31, 2012, accumulated other comprehensive losses related to interest rate derivatives included $2.4 million of net losses
expected to be reclassified into earnings during the next 12 months as the related hedged interest rate transactions impact
earnings, including forecasted amounts for any unsettled hedges.