Xcel Energy 2009 Annual Report Download - page 95
Download and view the complete annual report
Please find page 95 of the 2009 Xcel Energy annual report below. You can navigate through the pages in the report by either clicking on the pages listed below, or by using the keyword search tool below to find specific information within the annual report.-
 1
1 -
2
-
3
-
4
-
5
-
6
-
7
-
8
-
9
-
10
-
11
-
12
-
13
-
14
-
15
-
16
-
17
-
18
-
19
-
20
-
21
-
22
-
23
-
24
-
25
-
26
-
27
-
28
-
29
-
30
-
31
-
32
-
33
-
34
-
35
-
36
-
37
-
38
-
39
-
40
-
41
-
42
-
43
-
44
-
45
-
46
-
47
-
48
-
49
-
50
-
51
-
52
-
53
-
54
-
55
-
56
-
57
-
58
-
59
-
60
-
61
-
62
-
63
-
64
-
65
-
66
-
67
-
68
-
69
-
70
-
71
-
72
-
73
-
74
-
75
-
76
-
77
-
78
-
79
-
80
-
81
-
82
-
83
-
84
-
 85
85 -
 86
86 -
 87
87 -
 88
88 -
 89
89 -
 90
90 -
 91
91 -
 92
92 -
 93
93 -
 94
94 -
 95
95 -
 96
96 -
 97
97 -
 98
98 -
 99
99 -
 100
100 -
 101
101 -
 102
102 -
 103
103 -
 104
104 -
 105
105 -
106
-
107
-
108
-
109
-
110
-
111
-
112
-
113
-
114
-
115
-
116
-
117
-
118
-
119
-
120
-
121
-
122
-
123
-
124
-
125
-
126
-
127
-
128
-
129
-
130
-
131
-
132
-
133
-
134
-
135
-
136
-
137
-
138
-
139
-
140
-
141
-
142
-
143
-
144
-
145
-
146
-
147
-
148
-
149
-
150
-
151
-
152
-
153
-
154
-
155
-
156
-
157
-
158
-
159
-
160
-
161
-
162
-
163
-
164
-
165
-
166
-
167
-
168
-
169
-
170
-
171
-
172
 |
 |

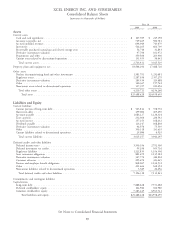
XCEL ENERGY INC. AND SUBSIDIARIES
Consolidated Balance Sheets
(amounts in thousands of dollars)
Dec. 31
2009 2008
Assets
Current assets
Cash and cash equivalents ................................................. $ 107,789 $ 249,198
Accounts receivable, net .................................................. 729,409 900,781
Accrued unbilled revenues ................................................. 694,049 743,479
Inventories .......................................................... 566,205 666,709
Recoverable purchased natural gas and electric energy costs ............................ 56,744 32,843
Derivative instruments valuation ............................................. 97,700 101,972
Prepayments and other ................................................... 359,560 263,906
Current assets related to discontinued operations ................................... 151,955 56,641
Total current assets .................................................... 2,763,411 3,015,529
Property, plant and equipment, net ............................................. 18,508,296 17,688,720
Other assets
Nuclear decommissioning fund and other investments ............................... 1,381,791 1,232,081
Regulatory assets ....................................................... 2,287,636 2,357,279
Derivative instruments valuation ............................................. 289,530 325,688
Other ............................................................. 140,367 157,742
Noncurrent assets related to discontinued operations ................................ 117,397 181,456
Total other assets ..................................................... 4,216,721 4,254,246
Total assets ....................................................... $25,488,428 $24,958,495
Liabilities and Equity
Current liabilities
Current portion of long-term debt ............................................ $ 543,814 $ 558,772
Short-term debt ....................................................... 459,000 455,250
Accounts payable ...................................................... 1,083,127 1,120,324
Taxes accrued ......................................................... 232,964 220,542
Accrued interest ....................................................... 157,253 168,632
Dividends payable ...................................................... 113,147 108,838
Derivative instruments valuation ............................................. 46,554 75,539
Other ............................................................. 350,318 331,419
Current liabilities related to discontinued operations ................................. 29,080 6,929
Total current liabilities ................................................. 3,015,257 3,046,245
Deferred credits and other liabilities
Deferred income taxes ................................................... 3,336,354 2,792,560
Deferred investment tax credits .............................................. 99,290 105,716
Regulatory liabilities .................................................... 1,222,833 1,194,596
Asset retirement obligations ................................................ 881,479 1,135,182
Derivative instruments valuation ............................................. 307,770 340,802
Customer advances ..................................................... 295,470 323,445
Pension and employee benefit obligations ....................................... 838,067 1,030,532
Other ............................................................. 211,666 168,352
Noncurrent liabilities related to discontinued operations .............................. 3,389 20,656
Total deferred credits and other liabilities ...................................... 7,196,318 7,111,841
Commitments and contingent liabilities
Capitalization
Long-term debt ....................................................... 7,888,628 7,731,688
Preferred stockholders’ equity ............................................... 104,980 104,980
Common stockholders’ equity .............................................. 7,283,245 6,963,741
Total liabilities and equity .............................................. $25,488,428 $24,958,495
See Notes to Consolidated Financial Statements
85