Xcel Energy 2009 Annual Report Download - page 122
Download and view the complete annual report
Please find page 122 of the 2009 Xcel Energy annual report below. You can navigate through the pages in the report by either clicking on the pages listed below, or by using the keyword search tool below to find specific information within the annual report.-
 1
1 -
2
-
3
-
4
-
5
-
6
-
7
-
8
-
9
-
10
-
11
-
12
-
13
-
14
-
15
-
16
-
17
-
18
-
19
-
20
-
21
-
22
-
23
-
24
-
25
-
26
-
27
-
28
-
29
-
30
-
31
-
32
-
33
-
34
-
35
-
36
-
37
-
38
-
39
-
40
-
41
-
42
-
43
-
44
-
45
-
46
-
47
-
48
-
49
-
50
-
51
-
52
-
53
-
54
-
55
-
56
-
57
-
58
-
59
-
60
-
61
-
62
-
63
-
64
-
65
-
66
-
67
-
68
-
69
-
70
-
71
-
72
-
73
-
74
-
75
-
76
-
77
-
78
-
79
-
80
-
81
-
82
-
83
-
84
-
85
-
86
-
87
-
88
-
89
-
90
-
91
-
92
-
93
-
94
-
95
-
96
-
97
-
98
-
99
-
100
-
101
-
102
-
103
-
104
-
105
-
106
-
107
-
108
-
109
-
110
-
111
-
 112
112 -
 113
113 -
 114
114 -
 115
115 -
 116
116 -
 117
117 -
 118
118 -
 119
119 -
 120
120 -
 121
121 -
 122
122 -
 123
123 -
 124
124 -
 125
125 -
 126
126 -
 127
127 -
 128
128 -
 129
129 -
 130
130 -
 131
131 -
 132
132 -
133
-
134
-
135
-
136
-
137
-
138
-
139
-
140
-
141
-
142
-
143
-
144
-
145
-
146
-
147
-
148
-
149
-
150
-
151
-
152
-
153
-
154
-
155
-
156
-
157
-
158
-
159
-
160
-
161
-
162
-
163
-
164
-
165
-
166
-
167
-
168
-
169
-
170
-
171
-
172
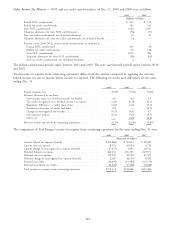
 |
 |

2009 2008
(Thousands of Dollars)
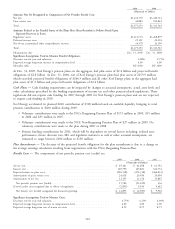
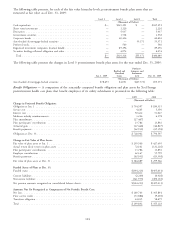
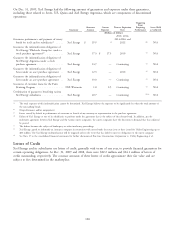
Amounts Not Yet Recognized as Components of Net Periodic Benefit Cost:
Net loss ............................................................ $1,432,370 $1,220,721
Prior service cost ...................................................... 42,883 102,842
Total .............................................................. $1,475,253 $1,323,563
Amounts Related to the Funded Status of the Plans Have Been Recorded as Follows Based Upon
Expected Recovery in Rates:
Regulatory assets ...................................................... $1,413,774 $1,268,879
Deferred income taxes ................................................... 25,101 22,294
Net-of-tax accumulated other comprehensive income ................................ 36,378 32,390
Total .............................................................. $1,475,253 $1,323,563
Measurement date ...................................................... Dec. 31, 2009 Dec. 31, 2008
Significant Assumptions Used to Measure Benefit Obligations:
Discount rate for year-end valuation .......................................... 6.00% 6.75%
Expected average long-term increase in compensation level ............................. 4.00 4.00
Mortality table ........................................................ RP 2000 RP 2000
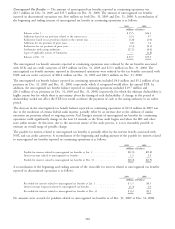
At Dec. 31, 2009, Xcel Energy’s pension plans, in the aggregate, had plan assets of $2.4 billion and projected benefit
obligations of $2.8 billion. At Dec. 31, 2008, one of Xcel Energy’s pension plans had plan assets of $259.9 million,
which exceeded projected benefit obligations of $244.3 million and all other Xcel Energy plans in the aggregate had
plan assets of $1.9 billion and projected benefit obligations of $2.4 billion.
Cash Flows — Cash funding requirements can be impacted by changes to actuarial assumptions, actual asset levels and
other calculations prescribed by the funding requirements of income tax and other pension-related regulations. These
regulations did not require cash funding for 2007 through 2009 for Xcel Energy’s pension plans and are not expected
to require cash funding in 2010.
Xcel Energy accelerated its planned 2010 contribution of $100 million based on available liquidity, bringing its total
pension contributions to $200 million during 2009.
• Voluntary contributions were made to the PSCo Bargaining Pension Plan of $173 million in 2009, $35 million
in 2008 and $35 million in 2007.
• Voluntary contributions were made to the NCE Non-Bargaining Pension Plan of $27 million in 2009. No
voluntary contributions were made to the plan during 2007 or 2008.
• Pension funding contributions for 2011, which will be dependent on several factors including, realized asset
performance, future discount rate, IRS and legislative initiatives as well as other actuarial assumptions, are
estimated to range between $100 million to $150 million.
Plan Amendments — The decrease of the projected benefit obligation for the plan amendment is due to a change in
the average earnings calculation resulting from negotiations with the PSCo Bargaining Pension Plan.
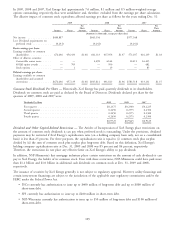
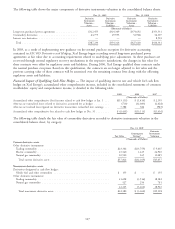
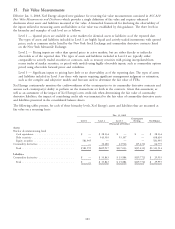
Benefit Costs — The components of net periodic pension cost (credit) are:
2009 2008 2007
(Thousands of Dollars)
Service cost ................................................. $ 65,461 $ 62,698 $ 61,392
Interest cost ................................................. 169,790 167,881 162,774
Expected return on plan assets ..................................... (256,538) (274,338) (264,831)
Amortization of prior service cost ................................... 24,618 20,584 25,056
Amortization of net loss ......................................... 12,455 11,156 15,845
Net periodic pension cost (credit) .................................. 15,786 (12,019) 236
(Costs) credits not recognized due to effects of regulation .................... (2,891) 9,034 9,682
Net benefit cost (credit) recognized for financial reporting ................... $ 12,895 $ (2,985) $ 9,918
Significant Assumptions Used to Measure Costs:
Discount rate for year-end valuation .................................. 6.75% 6.25% 6.00%
Expected average long-term increase in compensation level .................... 4.00 4.00 4.00
Expected average long-term rate of return on assets ........................ 8.50 8.75 8.75
112