Xcel Energy 2009 Annual Report Download - page 93
Download and view the complete annual report
Please find page 93 of the 2009 Xcel Energy annual report below. You can navigate through the pages in the report by either clicking on the pages listed below, or by using the keyword search tool below to find specific information within the annual report.-
 1
1 -
2
-
3
-
4
-
5
-
6
-
7
-
8
-
9
-
10
-
11
-
12
-
13
-
14
-
15
-
16
-
17
-
18
-
19
-
20
-
21
-
22
-
23
-
24
-
25
-
26
-
27
-
28
-
29
-
30
-
31
-
32
-
33
-
34
-
35
-
36
-
37
-
38
-
39
-
40
-
41
-
42
-
43
-
44
-
45
-
46
-
47
-
48
-
49
-
50
-
51
-
52
-
53
-
54
-
55
-
56
-
57
-
58
-
59
-
60
-
61
-
62
-
63
-
64
-
65
-
66
-
67
-
68
-
69
-
70
-
71
-
72
-
73
-
74
-
75
-
76
-
77
-
78
-
79
-
80
-
81
-
82
-
 83
83 -
 84
84 -
 85
85 -
 86
86 -
 87
87 -
 88
88 -
 89
89 -
 90
90 -
 91
91 -
 92
92 -
 93
93 -
 94
94 -
 95
95 -
 96
96 -
 97
97 -
 98
98 -
 99
99 -
 100
100 -
 101
101 -
 102
102 -
 103
103 -
104
-
105
-
106
-
107
-
108
-
109
-
110
-
111
-
112
-
113
-
114
-
115
-
116
-
117
-
118
-
119
-
120
-
121
-
122
-
123
-
124
-
125
-
126
-
127
-
128
-
129
-
130
-
131
-
132
-
133
-
134
-
135
-
136
-
137
-
138
-
139
-
140
-
141
-
142
-
143
-
144
-
145
-
146
-
147
-
148
-
149
-
150
-
151
-
152
-
153
-
154
-
155
-
156
-
157
-
158
-
159
-
160
-
161
-
162
-
163
-
164
-
165
-
166
-
167
-
168
-
169
-
170
-
171
-
172
 |
 |

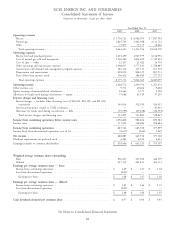
XCEL ENERGY INC. AND SUBSIDIARIES
Consolidated Statements of Income
(amounts in thousands, except per share data)
Year Ended Dec. 31
2009 2008 2007
Operating revenues
Electric .................................................. $7,704,723 $ 8,682,993 $ 7,847,992
Natural gas ................................................ 1,865,703 2,442,988 2,111,732
Other ................................................... 73,877 77,175 74,446
Total operating revenues ...................................... 9,644,303 11,203,156 10,034,170
Operating expenses
Electric fuel and purchased power .................................. 3,672,490 4,947,979 4,136,994
Cost of natural gas sold and transported ............................. 1,266,440 1,832,699 1,547,622
Cost of sales — other ......................................... 22,107 21,082 24,370
Other operating and maintenance expenses ............................ 1,908,097 1,777,933 1,788,885
Conservation and demand side management program expenses ................ 182,112 117,713 101,772
Depreciation and amortization .................................... 818,052 828,379 805,731
Taxes (other than income taxes) ................................... 306,433 286,580 277,723
Total operating expenses ...................................... 8,175,731 9,812,365 8,683,097
Operating income ........................................... 1,468,572 1,390,791 1,351,073
Other income, net ............................................. 9,771 40,406 9,048
Equity earnings of unconsolidated subsidiaries ............................ 24,664 3,571 1,900
Allowance for funds used during construction — equity ..................... 75,686 63,519 37,207
Interest charges and financing costs
Interest charges — includes other financing costs of $20,162, $20,390, and $21,410,
respectively .............................................. 561,654 552,919 520,037
Interest and penalties related to COLI settlement ........................ — — 43,401
Allowance for funds used during construction — debt ..................... (39,799) (39,038) (34,593)
Total interest charges and financing costs ............................ 521,855 513,881 528,845
Income from continuing operations before income taxes .................. 1,056,838 984,406 870,383
Income taxes ................................................ 371,314 338,686 294,484
Income from continuing operations ................................ 685,524 645,720 575,899
Income (loss) from discontinued operations, net of tax ...................... (4,637) (166) 1,449
Net income ............................................... 680,887 645,554 577,348
Dividend requirements on preferred stock .............................. 4,241 4,241 4,241
Earnings available to common shareholders ............................. $ 676,646 $ 641,313 $ 573,107
Weighted average common shares outstanding:
Basic ................................................... 456,433 437,054 416,139
Diluted .................................................. 457,139 441,813 433,131
Earnings per average common share — basic:
Income from continuing operations ................................ $ 1.49 $ 1.47 $ 1.38
Loss from discontinued operations ................................. (0.01) — —
Earnings per share .......................................... $ 1.48 $ 1.47 $ 1.38
Earnings per average common share — diluted:
Income from continuing operations ................................ $ 1.49 $ 1.46 $ 1.35
Loss from discontinued operations ................................. (0.01) — —
Earnings per share .......................................... $ 1.48 $ 1.46 $ 1.35
Cash dividends declared per common share ........................... $ 0.97 $ 0.94 $ 0.91
See Notes to Consolidated Financial Statements
83