Xcel Energy 2009 Annual Report Download - page 94
Download and view the complete annual report
Please find page 94 of the 2009 Xcel Energy annual report below. You can navigate through the pages in the report by either clicking on the pages listed below, or by using the keyword search tool below to find specific information within the annual report.-
 1
1 -
2
-
3
-
4
-
5
-
6
-
7
-
8
-
9
-
10
-
11
-
12
-
13
-
14
-
15
-
16
-
17
-
18
-
19
-
20
-
21
-
22
-
23
-
24
-
25
-
26
-
27
-
28
-
29
-
30
-
31
-
32
-
33
-
34
-
35
-
36
-
37
-
38
-
39
-
40
-
41
-
42
-
43
-
44
-
45
-
46
-
47
-
48
-
49
-
50
-
51
-
52
-
53
-
54
-
55
-
56
-
57
-
58
-
59
-
60
-
61
-
62
-
63
-
64
-
65
-
66
-
67
-
68
-
69
-
70
-
71
-
72
-
73
-
74
-
75
-
76
-
77
-
78
-
79
-
80
-
81
-
82
-
83
-
 84
84 -
 85
85 -
 86
86 -
 87
87 -
 88
88 -
 89
89 -
 90
90 -
 91
91 -
 92
92 -
 93
93 -
 94
94 -
 95
95 -
 96
96 -
 97
97 -
 98
98 -
 99
99 -
 100
100 -
 101
101 -
 102
102 -
 103
103 -
 104
104 -
105
-
106
-
107
-
108
-
109
-
110
-
111
-
112
-
113
-
114
-
115
-
116
-
117
-
118
-
119
-
120
-
121
-
122
-
123
-
124
-
125
-
126
-
127
-
128
-
129
-
130
-
131
-
132
-
133
-
134
-
135
-
136
-
137
-
138
-
139
-
140
-
141
-
142
-
143
-
144
-
145
-
146
-
147
-
148
-
149
-
150
-
151
-
152
-
153
-
154
-
155
-
156
-
157
-
158
-
159
-
160
-
161
-
162
-
163
-
164
-
165
-
166
-
167
-
168
-
169
-
170
-
171
-
172
 |
 |

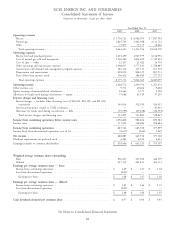
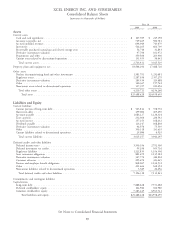
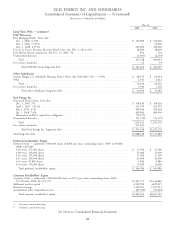
XCEL ENERGY INC. AND SUBSIDIARIES
Consolidated Statements of Cash Flows
(amounts in thousands of dollars)
Year Ended Dec. 31
2009 2008 2007
Operating activities
Net income .................................................... $ 680,887 $ 645,554 $ 577,348
Remove loss (income) from discontinued operations ............................. 4,637 166 (1,449)
Adjustments to reconcile net income to cash provided by operating activities:
Depreciation and amortization ........................................ 835,597 843,461 834,455
Conservation and demand side management program expenses ..................... 29,418 39,931 21,442
Nuclear fuel amortization ........................................... 80,104 64,203 53,453
Deferred income taxes ............................................ 416,581 259,045 265,277
Amortization of investment tax credits ................................... (6,426) (7,198) (8,680)
Allowance for equity funds used during construction ........................... (75,686) (63,519) (37,207)
Equity earnings of unconsolidated subsidiaries ............................... (24,664) (3,571) (1,900)
Dividends from equity method investees .................................. 29,059 — —
Provision for bad debts ............................................ 49,023 63,407 57,434
Share-based compensation expense ..................................... 29,672 25,511 22,871
Net realized and unrealized hedging and derivative transactions ..................... 39,029 (31,895) 6,463
Changes in operating assets and liabilities:
Accounts receivable ............................................. 122,785 (14,108) (136,807)
Accrued unbilled revenues ......................................... 49,430 (11,520) (217,659)
Inventories .................................................. 100,504 (135,099) (25,464)
Recoverable purchased natural gas and electric energy costs ...................... (23,901) 33,947 185,185
Other current assets ............................................ (48,097) 11,937 (9,922)
Accounts payable .............................................. (50,015) 28,422 (10,018)
Net regulatory assets and liabilities .................................... (24,379) (70,993) 27,428
Other current liabilities .......................................... 37,701 48,819 52,771
Pension and other employee benefit obligations ............................. (246,002) (104,972) (96,930)
Change in other noncurrent assets ..................................... (9,451) 54,327 3,265
Change in other noncurrent liabilities ................................... (49,119) 6,984 (2,168)
Operating cash flows (used in) provided by discontinued operations .................... (28,223) (3,323) 72,346
Net cash provided by operating activities ................................ 1,918,464 1,679,516 1,631,534
Investing activities
Utility capital/construction expenditures .................................. (1,786,902) (2,113,246) (2,096,857)
Allowance for equity funds used during construction ........................... 75,686 63,519 37,207
Purchase of investments in external decommissioning fund ....................... (1,644,278) (957,752) (712,462)
Proceeds from the sale of investments in external decommissioning fund ............... 1,664,957 914,514 669,070
Investment in WYCO Development LLC ................................. (42,490) (97,924) (29,659)
Change in restricted cash ........................................... 264 32,008 (9,190)
Cash obtained from consolidation of NMC ................................ — — 38,950
Other investments ............................................... (1,904) 2,564 20,832
Net cash used in investing activities ................................... (1,734,667) (2,156,317) (2,082,109)
Financing activities
Proceeds (repayment) of short-term borrowings, net ........................... 3,750 (633,310) 462,260
Proceeds from issuance of long-term debt ................................. 689,915 1,915,060 1,162,272
Repayment of long-term debt, including reacquisition premiums .................... (621,296) (581,313) (768,146)
Proceeds from issuance of common stock ................................. 20,133 352,871 10,539
Dividends paid ................................................. (414,922) (382,282) (378,892)
Early participation payment on debt exchange ............................... — — (4,859)
Net cash (used in) provided by financing activities ........................... (322,420) 671,026 483,174
Net increase (decrease) in cash and cash equivalents ............................. (138,623) 194,225 32,599
Net increase (decrease) in cash and cash equivalents — discontinued operations ............. (2,786) 3,853 (18,937)
Cash and cash equivalents at beginning of period .............................. 249,198 51,120 37,458
Cash and cash equivalents at end of period .................................. $ 107,789 $ 249,198 $ 51,120
Supplemental disclosure of cash flow information:
Cash paid for interest (net of amounts capitalized) ............................ $ (514,675) $ (485,373) $ (469,142)
Cash received (paid) for income taxes, net ................................. 21,154 (94,744) (6,467)
Supplemental disclosure of non-cash investing transactions:
Property, plant and equipment additions in accounts payable ...................... $ 68,417 $ 55,715 $ 39,681
Storage assets under capital lease ....................................... 71,553 — —
Supplemental disclosure of non-cash financing transactions:
Issuance of common stock for reinvested dividends and 401(k) plans .................. $ 54,638 $ 56,009 $ 53,105
Issuance of common stock for senior convertible notes .......................... — 57,500 229,623
See Notes to Consolidated Financial Statements
84