Xcel Energy 2009 Annual Report Download - page 66
Download and view the complete annual report
Please find page 66 of the 2009 Xcel Energy annual report below. You can navigate through the pages in the report by either clicking on the pages listed below, or by using the keyword search tool below to find specific information within the annual report.-
 1
1 -
2
-
3
-
4
-
5
-
6
-
7
-
8
-
9
-
10
-
11
-
12
-
13
-
14
-
15
-
16
-
17
-
18
-
19
-
20
-
21
-
22
-
23
-
24
-
25
-
26
-
27
-
28
-
29
-
30
-
31
-
32
-
33
-
34
-
35
-
36
-
37
-
38
-
39
-
40
-
41
-
42
-
43
-
44
-
45
-
46
-
47
-
48
-
49
-
50
-
51
-
52
-
53
-
54
-
55
-
 56
56 -
 57
57 -
 58
58 -
 59
59 -
 60
60 -
 61
61 -
 62
62 -
 63
63 -
 64
64 -
 65
65 -
 66
66 -
 67
67 -
 68
68 -
 69
69 -
 70
70 -
 71
71 -
 72
72 -
 73
73 -
 74
74 -
 75
75 -
 76
76 -
77
-
78
-
79
-
80
-
81
-
82
-
83
-
84
-
85
-
86
-
87
-
88
-
89
-
90
-
91
-
92
-
93
-
94
-
95
-
96
-
97
-
98
-
99
-
100
-
101
-
102
-
103
-
104
-
105
-
106
-
107
-
108
-
109
-
110
-
111
-
112
-
113
-
114
-
115
-
116
-
117
-
118
-
119
-
120
-
121
-
122
-
123
-
124
-
125
-
126
-
127
-
128
-
129
-
130
-
131
-
132
-
133
-
134
-
135
-
136
-
137
-
138
-
139
-
140
-
141
-
142
-
143
-
144
-
145
-
146
-
147
-
148
-
149
-
150
-
151
-
152
-
153
-
154
-
155
-
156
-
157
-
158
-
159
-
160
-
161
-
162
-
163
-
164
-
165
-
166
-
167
-
168
-
169
-
170
-
171
-
172
 |
 |

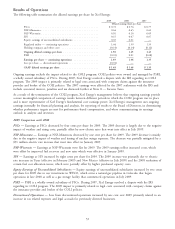
Higher 2009 ongoing earnings were primarily due to improved electric margins as a result of constructive rate case
outcomes in Minnesota, Colorado, Texas, New Mexico and Wisconsin, which were partially mitigated by the negative
impact of weather, lower sales and higher purchase capacity power costs. Offsetting stronger electric margins were higher
operating and maintenance expenses, resulting from increased employee benefit costs as well as higher nuclear expenses,
and dilution from the issuance of equity to fund the capital investment program.
Earnings from continuing operations for 2008 were higher than in 2007 primarily attributed to lower O&M expense,
higher electric and gas margins, and higher AFUDC — equity. Partially offsetting these positive factors were higher
depreciation and amortization, higher conservation and DSM program expenses, increased interest expense and a higher
ETR.
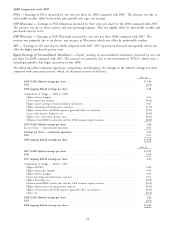
Statement of Operations Analysis — Continuing Operations
The following discussion summarizes the items that affected the individual revenue and expense items reported in the
consolidated statements of income.
Weather — Xcel Energy’s earnings can be significantly affected by weather. Unseasonably hot summers or cold winters
increase electric and natural gas sales, but also can increase O&M expenses. Unseasonably mild weather reduces electric
and natural gas sales, but may not reduce O&M expenses. The impact of weather on earnings is based on the number
of customers, temperature variances and the amount of natural gas or electricity the average customer historically uses
per degree of temperature.
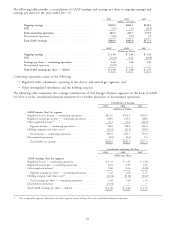
Estimated Impact of Temperature Changes on Regulated Earnings — The following table summarizes the estimated
impact on earnings per share of temperature variations compared with sales under normal weather conditions.
2009 vs. Normal 2008 vs. Normal 2009 vs. 2008 2007 vs. Normal 2008 vs. 2007
Retail electric ............ $(0.05) $(0.01) $(0.04) $0.06 $(0.07)
Firm natural gas .......... — 0.01 (0.01) — 0.01
Total ................. $(0.05) $ — $(0.05) $0.06 $(0.06)
Sales Growth (Decline) — The following table summarizes Xcel Energy’s regulated sales growth (decline) for actual and
weather-normalized energy sales for the years ended Dec. 31, compared with the previous year. The year-end sales
growth amounts for 2008 have been adjusted for leap year.
2009 2008
Actual Normalized Actual Normalized
Electric residential ............................... (1.4)% 0.7% (2.0)% —%
Electric commercial and industrial ..................... (3.3) (2.7) 1.5 2.4
Total retail electric sales .......................... (2.7) (1.8) 0.5 1.7
Firm natural gas sales ............................. (2.6) 0.1 4.9 1.9
During 2009, we experienced lower than anticipated actual electric residential sales, and a decline in electric commercial
and industrial sales on a weather-adjusted basis, which we believe was driven by overall economic conditions and to a
lesser degree, increased conservation efforts. The declines in MwH sales to the commercial and industrial customer
class, which are directly related to the economic downturn, are partially offset by demand charges, which mitigate, to a
certain degree, the impact of the lower MwH sales. We anticipate that sales will grow in the future at a slower rate than
historical levels in part due to increased conservation activities. Weather-normalized sales for 2010 are projected to grow
approximately 1 percent for retail electric customers and to decline approximately 1 percent to 2 percent for retail firm
natural gas customers.
56