Xcel Energy 2009 Annual Report Download - page 63
Download and view the complete annual report
Please find page 63 of the 2009 Xcel Energy annual report below. You can navigate through the pages in the report by either clicking on the pages listed below, or by using the keyword search tool below to find specific information within the annual report.-
 1
1 -
2
-
3
-
4
-
5
-
6
-
7
-
8
-
9
-
10
-
11
-
12
-
13
-
14
-
15
-
16
-
17
-
18
-
19
-
20
-
21
-
22
-
23
-
24
-
25
-
26
-
27
-
28
-
29
-
30
-
31
-
32
-
33
-
34
-
35
-
36
-
37
-
38
-
39
-
40
-
41
-
42
-
43
-
44
-
45
-
46
-
47
-
48
-
49
-
50
-
51
-
52
-
 53
53 -
 54
54 -
 55
55 -
 56
56 -
 57
57 -
 58
58 -
 59
59 -
 60
60 -
 61
61 -
 62
62 -
 63
63 -
 64
64 -
 65
65 -
 66
66 -
 67
67 -
 68
68 -
 69
69 -
 70
70 -
 71
71 -
 72
72 -
 73
73 -
74
-
75
-
76
-
77
-
78
-
79
-
80
-
81
-
82
-
83
-
84
-
85
-
86
-
87
-
88
-
89
-
90
-
91
-
92
-
93
-
94
-
95
-
96
-
97
-
98
-
99
-
100
-
101
-
102
-
103
-
104
-
105
-
106
-
107
-
108
-
109
-
110
-
111
-
112
-
113
-
114
-
115
-
116
-
117
-
118
-
119
-
120
-
121
-
122
-
123
-
124
-
125
-
126
-
127
-
128
-
129
-
130
-
131
-
132
-
133
-
134
-
135
-
136
-
137
-
138
-
139
-
140
-
141
-
142
-
143
-
144
-
145
-
146
-
147
-
148
-
149
-
150
-
151
-
152
-
153
-
154
-
155
-
156
-
157
-
158
-
159
-
160
-
161
-
162
-
163
-
164
-
165
-
166
-
167
-
168
-
169
-
170
-
171
-
172
 |
 |

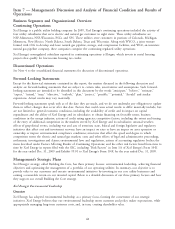
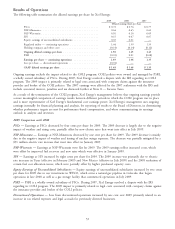
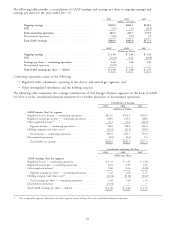
Results of Operations
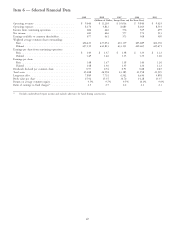
The following table summarizes the diluted earnings per share for Xcel Energy:
2009 2008 2007
Diluted earnings (loss) per share
PSCo ........................................ $0.72 $ 0.76 $ 0.77
NSP-Minnesota .................................. 0.64 0.65 0.62
NSP-Wisconsin .................................. 0.10 0.10 0.09
SPS ......................................... 0.15 0.07 0.07
Equity earnings of unconsolidated subsidiaries ............... 0.03 0.01 —
Regulated utility — continuing operations ................. 1.64 1.59 1.55
Holding company and other costs ...................... (0.14) (0.14) (0.12)
Ongoing diluted earnings per share ..................... 1.50 1.45 1.43
PSRI ........................................ (0.01) 0.01 (0.08)
Earnings per share — continuing operations ............... 1.49 1.46 1.35
Loss per share — discontinued operations .................. (0.01) — —
GAAP diluted earnings per share ....................... $ 1.48 $ 1.46 $ 1.35
Ongoing earnings exclude the impact related to the COLI program. COLI policies were owned and managed by PSRI,
a wholly owned subsidiary of PSCo. During 2007, Xcel Energy resolved a dispute with the IRS regarding its COLI
program. The 2009 impact is primarily related to legal costs associated with company claims against the insurance
provider and broker of the COLI policies. The 2007 earnings were affected by the 2007 settlement with the IRS and
include associated interest, penalties and tax discussed further at Note 8 — Income Taxes.
As a result of the termination of the COLI program, Xcel Energy’s management believes that ongoing earnings provide
a more meaningful comparison of earnings results between different periods in which the COLI program was in place
and is more representative of Xcel Energy’s fundamental core earnings power. Xcel Energy’s management uses ongoing
earnings internally for financial planning and analysis, for reporting of results to the Board of Directors, in determining
whether performance targets are met for performance-based compensation, and when communicating its earnings
outlook to analysts and investors.
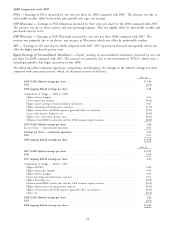
2009 Comparison with 2008
PSCo — Earnings at PSCo decreased by four cents per share for 2009. The 2009 decrease is largely due to the negative
impact of weather and rising costs, partially offset by new electric rates that went into effect in July 2009.
NSP-Minnesota — Earnings at NSP-Minnesota decreased by one cent per share for 2009. The 2009 decrease is mainly
due to the negative impact of weather and timing of nuclear outage expenses. The decrease was partially mitigated by a
$91 million electric rate increase that went into effect in January 2009.
NSP-Wisconsin — Earnings at NSP-Wisconsin were flat for 2009. The 2009 earnings reflect increased costs, which
were offset by improved fuel recovery and new rates which were effective in January 2009.
SPS — Earnings at SPS increased by eight cents per share for 2009. The 2009 increase was primarily due to electric
rate increases in Texas (effective in February 2009) and New Mexico (effective in July 2009) and the 2008 resolution of
certain fuel cost allocation issues, which were partially offset by higher purchased capacity costs.
Equity Earnings of Unconsolidated Subsidiaries — Equity earnings of unconsolidated subsidiaries increased by two cents
per share for 2009 due to our investment in WYCO, which owns a natural gas pipeline in Colorado that began
operations in late 2008 as well as a gas storage facility that commenced operations in July 2009.
PSRI — PSRI is a wholly owned subsidiary of PSCo. During 2007, Xcel Energy resolved a dispute with the IRS
regarding its COLI program. The 2009 impact is primarily related to legal costs associated with company claims against
the insurance provider and broker of the COLI policies.
Discontinued Operations — Loss from discontinued operations increased by one cent over 2009 primarily related to an
increase in tax related expenses and legal accruals for previously divested businesses.
53