Xcel Energy 2009 Annual Report Download - page 132
Download and view the complete annual report
Please find page 132 of the 2009 Xcel Energy annual report below. You can navigate through the pages in the report by either clicking on the pages listed below, or by using the keyword search tool below to find specific information within the annual report.-
 1
1 -
2
-
3
-
4
-
5
-
6
-
7
-
8
-
9
-
10
-
11
-
12
-
13
-
14
-
15
-
16
-
17
-
18
-
19
-
20
-
21
-
22
-
23
-
24
-
25
-
26
-
27
-
28
-
29
-
30
-
31
-
32
-
33
-
34
-
35
-
36
-
37
-
38
-
39
-
40
-
41
-
42
-
43
-
44
-
45
-
46
-
47
-
48
-
49
-
50
-
51
-
52
-
53
-
54
-
55
-
56
-
57
-
58
-
59
-
60
-
61
-
62
-
63
-
64
-
65
-
66
-
67
-
68
-
69
-
70
-
71
-
72
-
73
-
74
-
75
-
76
-
77
-
78
-
79
-
80
-
81
-
82
-
83
-
84
-
85
-
86
-
87
-
88
-
89
-
90
-
91
-
92
-
93
-
94
-
95
-
96
-
97
-
98
-
99
-
100
-
101
-
102
-
103
-
104
-
105
-
106
-
107
-
108
-
109
-
110
-
111
-
112
-
113
-
114
-
115
-
116
-
117
-
118
-
119
-
120
-
121
-
 122
122 -
 123
123 -
 124
124 -
 125
125 -
 126
126 -
 127
127 -
 128
128 -
 129
129 -
 130
130 -
 131
131 -
 132
132 -
 133
133 -
 134
134 -
 135
135 -
 136
136 -
 137
137 -
 138
138 -
 139
139 -
 140
140 -
 141
141 -
 142
142 -
143
-
144
-
145
-
146
-
147
-
148
-
149
-
150
-
151
-
152
-
153
-
154
-
155
-
156
-
157
-
158
-
159
-
160
-
161
-
162
-
163
-
164
-
165
-
166
-
167
-
168
-
169
-
170
-
171
-
172
 |
 |

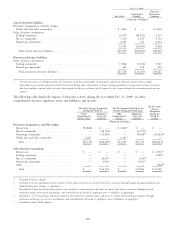
Dec. 31, 2008
Counterparty
Level 1 Level 2 Level 3 Netting Net Balance
(Thousands of Dollars)
Assets
Cash equivalents ......................... $ — $50,000 $ — $ — $ 50,000
Nuclear decommissioning fund ................ —
Cash equivalents ....................... — 8,449 — — 8,449
Debt securities ......................... — 491,486 109,423 — 600,909
Equity securities ........................ 465,936 — — — 465,936
Commodity derivatives ..................... — 29,648 39,565 (16,245) 52,968
Total ............................... $465,936 $579,583 $148,988 $(16,245) $1,178,262
Liabilities
Commodity derivatives ..................... $ 600 $78,714 $ 16,344 $(41,351) $ 54,307
Interest rate derivatives ..................... — 8,503 — — 8,503
Total ............................... $ 600 $ 87,217 $ 16,344 $(41,351) $ 62,810
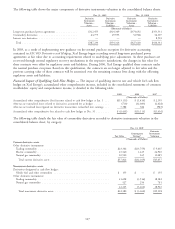
The following table presents the changes in Level 3 recurring fair value measurements for the year ended Dec. 31:
2009 2008
Commodity Nuclear Commodity Nuclear
Derivatives, Decommissioning Derivatives, Decommissioning
Net Fund Net Fund
(Thousands of Dollars)
Balance at Jan. 1 ................................. $23,221 $109,423 $19,466 $108,656
Purchases, issuances, and settlements, net ................. (4,143) (28,356) (5,981) 12,198
Transfers into (out of) Level 3 ....................... 1,280 — (3,962) —
(Losses) gains recognized in earnings ................... (581) — 2,129 —
Gains (losses) recognized as regulatory assets and liabilities ...... 8,265 12,040 11,569 (11,431)
Balance at Dec. 31 ................................ $28,042 $ 93,107 $23,221 $109,423
Losses on Level 3 commodity derivatives recognized in earnings for the year ended Dec. 31, 2009, include $8.2 million
of net unrealized gains relating to commodity derivatives held at Dec. 31, 2009. Gains on Level 3 commodity
derivatives recognized in earnings for the year ended Dec. 31, 2008, include $3.7 million of net unrealized gains
relating to commodity derivatives held at Dec. 31, 2008. Realized and unrealized gains and losses on commodity
trading activities are included in electric revenues. Realized and unrealized gains and losses on non-trading derivative
instruments are recorded in OCI or deferred as regulatory assets and liabilities. The classification as a regulatory asset or
liability is based on the commission approved regulatory recovery mechanisms. Realized and unrealized gains and losses
on nuclear decommissioning fund investments are deferred as a component of a nuclear decommissioning regulatory
asset.
16. Rate Matters
NSP-Minnesota
Pending and Recently Concluded Regulatory Proceedings — MPUC
Base Rate
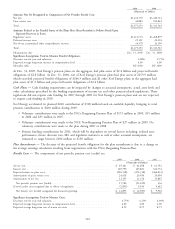
NSP-Minnesota Electric Rate Case — In November 2008, NSP-Minnesota filed a request with the MPUC to increase
Minnesota electric rates by $156 million annually. This request was later modified to $136 million.
In September 2009, the MPUC voted to approve a rate increase of approximately $91.4 million. As part of its decision,
the MPUC approved a 10-year life extension of the Prairie Island nuclear plant for purposes of determining
depreciation and decommissioning expenses, effective Jan. 1, 2009. This decision reduced NSP-Minnesota’s overall
122