Xcel Energy 2009 Annual Report Download - page 69
Download and view the complete annual report
Please find page 69 of the 2009 Xcel Energy annual report below. You can navigate through the pages in the report by either clicking on the pages listed below, or by using the keyword search tool below to find specific information within the annual report.-
 1
1 -
2
-
3
-
4
-
5
-
6
-
7
-
8
-
9
-
10
-
11
-
12
-
13
-
14
-
15
-
16
-
17
-
18
-
19
-
20
-
21
-
22
-
23
-
24
-
25
-
26
-
27
-
28
-
29
-
30
-
31
-
32
-
33
-
34
-
35
-
36
-
37
-
38
-
39
-
40
-
41
-
42
-
43
-
44
-
45
-
46
-
47
-
48
-
49
-
50
-
51
-
52
-
53
-
54
-
55
-
56
-
57
-
58
-
 59
59 -
 60
60 -
 61
61 -
 62
62 -
 63
63 -
 64
64 -
 65
65 -
 66
66 -
 67
67 -
 68
68 -
 69
69 -
 70
70 -
 71
71 -
 72
72 -
 73
73 -
 74
74 -
 75
75 -
 76
76 -
 77
77 -
 78
78 -
 79
79 -
80
-
81
-
82
-
83
-
84
-
85
-
86
-
87
-
88
-
89
-
90
-
91
-
92
-
93
-
94
-
95
-
96
-
97
-
98
-
99
-
100
-
101
-
102
-
103
-
104
-
105
-
106
-
107
-
108
-
109
-
110
-
111
-
112
-
113
-
114
-
115
-
116
-
117
-
118
-
119
-
120
-
121
-
122
-
123
-
124
-
125
-
126
-
127
-
128
-
129
-
130
-
131
-
132
-
133
-
134
-
135
-
136
-
137
-
138
-
139
-
140
-
141
-
142
-
143
-
144
-
145
-
146
-
147
-
148
-
149
-
150
-
151
-
152
-
153
-
154
-
155
-
156
-
157
-
158
-
159
-
160
-
161
-
162
-
163
-
164
-
165
-
166
-
167
-
168
-
169
-
170
-
171
-
172
 |
 |

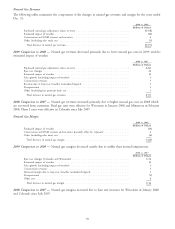
Natural Gas Revenues
The following tables summarize the components of the changes in natural gas revenues and margin for the years ended
Dec. 31:
2009 vs. 2008
(Millions of Dollars)
Purchased natural gas adjustment clause recovery ................................ $(568)
Estimated impact of weather ............................................ (10)
Conservation and DSM revenue and incentive ................................. 6
Other (including sales mix), net .......................................... (5)
Total decrease in natural gas revenues ..................................... $(577)
2009 Comparison to 2008 — Natural gas revenues decreased primarily due to lower natural gas costs in 2009, and the
estimated impact of weather.
2008 vs. 2007
(Millions of Dollars)
Purchased natural gas adjustment clause recovery ................................ $282
Base rate changes ................................................... 24
Estimated impact of weather ............................................ 10
Sales growth (excluding impact of weather) ................................... 5
Conservation revenues ................................................ 3
Revenue due to leap year (weather normalized impact) ............................ 1
Transportation ..................................................... 1
Other (including late payment fees), net ..................................... 5
Total increase in natural gas revenues ..................................... $331
2008 Comparison to 2007 — Natural gas revenues increased primarily due to higher natural gas costs in 2008 which
are recovered from customers. Final gas rates were effective for Wisconsin in January 2008 and Minnesota in February
2008. Phase I rates were effective in Colorado since July 2007.
Natural Gas Margin
2009 vs. 2008
(Millions of Dollars)
Estimated impact of weather ............................................ (10)
Conservation and DSM revenue and incentive (partially offset by expenses) ............... 6
Other (including sales mix), net .......................................... (6)
Total decrease in natural gas margin ...................................... $(10)
2009 Comparison to 2008 — Natural gas margins decreased mainly due to milder than normal temperatures.
2008 vs. 2007
(Millions of Dollars)
Base rate changes (Colorado and Wisconsin) .................................. $24
Estimated impact of weather ............................................ 10
Sales growth (excluding impact of weather) ................................... 5
Conservation revenues ................................................ 3
Increased margin due to leap year (weather normalized impact) ....................... 1
Transportation ..................................................... (1)
Other, net ........................................................ 4
Total increase in natural gas margin ...................................... $46
2008 Comparison to 2007 — Natural gas margins increased due to base rate increases for Wisconsin in January 2008
and Colorado since July 2007.
59