Xcel Energy 2009 Annual Report Download - page 64
Download and view the complete annual report
Please find page 64 of the 2009 Xcel Energy annual report below. You can navigate through the pages in the report by either clicking on the pages listed below, or by using the keyword search tool below to find specific information within the annual report.-
 1
1 -
2
-
3
-
4
-
5
-
6
-
7
-
8
-
9
-
10
-
11
-
12
-
13
-
14
-
15
-
16
-
17
-
18
-
19
-
20
-
21
-
22
-
23
-
24
-
25
-
26
-
27
-
28
-
29
-
30
-
31
-
32
-
33
-
34
-
35
-
36
-
37
-
38
-
39
-
40
-
41
-
42
-
43
-
44
-
45
-
46
-
47
-
48
-
49
-
50
-
51
-
52
-
53
-
 54
54 -
 55
55 -
 56
56 -
 57
57 -
 58
58 -
 59
59 -
 60
60 -
 61
61 -
 62
62 -
 63
63 -
 64
64 -
 65
65 -
 66
66 -
 67
67 -
 68
68 -
 69
69 -
 70
70 -
 71
71 -
 72
72 -
 73
73 -
 74
74 -
75
-
76
-
77
-
78
-
79
-
80
-
81
-
82
-
83
-
84
-
85
-
86
-
87
-
88
-
89
-
90
-
91
-
92
-
93
-
94
-
95
-
96
-
97
-
98
-
99
-
100
-
101
-
102
-
103
-
104
-
105
-
106
-
107
-
108
-
109
-
110
-
111
-
112
-
113
-
114
-
115
-
116
-
117
-
118
-
119
-
120
-
121
-
122
-
123
-
124
-
125
-
126
-
127
-
128
-
129
-
130
-
131
-
132
-
133
-
134
-
135
-
136
-
137
-
138
-
139
-
140
-
141
-
142
-
143
-
144
-
145
-
146
-
147
-
148
-
149
-
150
-
151
-
152
-
153
-
154
-
155
-
156
-
157
-
158
-
159
-
160
-
161
-
162
-
163
-
164
-
165
-
166
-
167
-
168
-
169
-
170
-
171
-
172
 |
 |

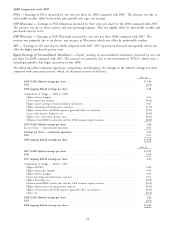
2008 Comparison with 2007
PSCo — Earnings at PSCo decreased by one cent per share for 2008 compared with 2007. The decrease was due to
unfavorable weather offset by favorable sales growth and a gas rate increase.
NSP-Minnesota — Earnings at NSP-Minnesota increased by three cents per share for the 2008 compared with 2007.
The increase was due to lower interest and non-operating expenses. This was slightly offset by unfavorable weather and
purchased capacity costs.
NSP-Wisconsin — Earnings at NSP-Wisconsin increased by one cent per share 2008 compared with 2007. The
increase was primarily due to an electric rate increase in Wisconsin, which was offset by unfavorable weather.
SPS — Earnings at SPS were flat for 2008 compared with 2007. SPS experienced increased sales growth, which was
offset by higher purchased capacity costs.
Equity Earnings of Unconsolidated Subsidiaries — Equity earnings of unconsolidated subsidiaries increased by one cent
per share for 2008 compared with 2007. The increase was primarily due to our investment in WYCO, which owns a
natural gas pipeline that began operations in late 2008.
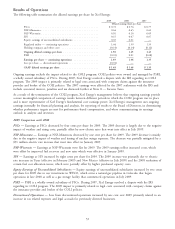
The following tables summarize significant components contributing to the changes in the diluted earnings per share
compared with same prior periods, which are discussed in more detail later.
Dec. 31,
2008 GAAP diluted earnings per share ........................................ $ 1.46
PSRI ............................................................. (0.01)
2008 ongoing diluted earnings per share ....................................... 1.45
Components of change — 2009 vs. 2008
Higher electric margins ................................................ 0.44
Lower natural gas margins ............................................... (0.02)
Higher equity earnings of unconsolidated subsidiaries .............................. 0.02
Higher operating and maintenance expenses .................................... (0.19)
Higher conservation and DSM expenses (generally offset in revenues) .................... (0.09)
Lower other income (expense), net ......................................... (0.05)
Higher taxes, other than income taxes ....................................... (0.03)
Dilution from DRIP, benefit plan and the 2008 common equity issuance ................. (0.05)
2009 GAAP diluted earnings per share ........................................ 1.48
Loss per share — discontinued operations ...................................... 0.01
Earnings per share — continuing operations .................................... 1.49
PSRI ............................................................. 0.01
2009 ongoing diluted earnings per share ....................................... $ 1.50
Dec. 31,
2007 GAAP diluted earnings per share ........................................ $ 1.35
PSRI ............................................................. 0.08
2007 ongoing diluted earnings per share ....................................... 1.43
Components of change — 2008 vs. 2007
Higher AFUDC ..................................................... 0.06
Higher natural gas margins .............................................. 0.06
Higher electric margins ................................................ 0.03
Lower operating and maintenance expenses .................................... 0.02
Higher financing costs ................................................. (0.05)
Dilution from DRIP, benefit plan and the 2008 common equity issuance ................. (0.03)
Higher depreciation and amortization expenses .................................. (0.03)
Higher conservation and DSM expenses (generally offset in revenues) .................... (0.02)
Other, net ......................................................... (0.01)
2008 GAAP diluted earnings per share ........................................ 1.46
PSRI ............................................................. (0.01)
2008 ongoing diluted earnings per share ....................................... $ 1.45
54