Xcel Energy 2009 Annual Report Download - page 67
Download and view the complete annual report
Please find page 67 of the 2009 Xcel Energy annual report below. You can navigate through the pages in the report by either clicking on the pages listed below, or by using the keyword search tool below to find specific information within the annual report.-
 1
1 -
2
-
3
-
4
-
5
-
6
-
7
-
8
-
9
-
10
-
11
-
12
-
13
-
14
-
15
-
16
-
17
-
18
-
19
-
20
-
21
-
22
-
23
-
24
-
25
-
26
-
27
-
28
-
29
-
30
-
31
-
32
-
33
-
34
-
35
-
36
-
37
-
38
-
39
-
40
-
41
-
42
-
43
-
44
-
45
-
46
-
47
-
48
-
49
-
50
-
51
-
52
-
53
-
54
-
55
-
56
-
 57
57 -
 58
58 -
 59
59 -
 60
60 -
 61
61 -
 62
62 -
 63
63 -
 64
64 -
 65
65 -
 66
66 -
 67
67 -
 68
68 -
 69
69 -
 70
70 -
 71
71 -
 72
72 -
 73
73 -
 74
74 -
 75
75 -
 76
76 -
 77
77 -
78
-
79
-
80
-
81
-
82
-
83
-
84
-
85
-
86
-
87
-
88
-
89
-
90
-
91
-
92
-
93
-
94
-
95
-
96
-
97
-
98
-
99
-
100
-
101
-
102
-
103
-
104
-
105
-
106
-
107
-
108
-
109
-
110
-
111
-
112
-
113
-
114
-
115
-
116
-
117
-
118
-
119
-
120
-
121
-
122
-
123
-
124
-
125
-
126
-
127
-
128
-
129
-
130
-
131
-
132
-
133
-
134
-
135
-
136
-
137
-
138
-
139
-
140
-
141
-
142
-
143
-
144
-
145
-
146
-
147
-
148
-
149
-
150
-
151
-
152
-
153
-
154
-
155
-
156
-
157
-
158
-
159
-
160
-
161
-
162
-
163
-
164
-
165
-
166
-
167
-
168
-
169
-
170
-
171
-
172
 |
 |

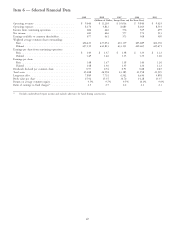
Electric Revenues and Margin
Electric fuel and purchased power expenses tend to vary with changing retail and wholesale sales requirements and unit
cost changes in fuel and purchased power. Due to fuel and purchased energy cost-recovery mechanisms for customers in
most states, the fluctuations in these costs do not materially affect electric margin. The following tables detail the
change in electric revenues and margin:
2009 2008 2007
(Millions of Dollars)
Electric revenues ................................ $7,705 $ 8,683 $ 7,848
Electric fuel and purchased power ...................... (3,672) (4,948) (4,137)
Electric margin ................................ $4,033 $ 3,735 $ 3,711
The following tables summarize the components of the changes in electric revenues and electric margin for the years
ended Dec. 31:
Electric Revenues
2009 vs. 2008
(Millions of Dollars)
Fuel and purchased power cost recovery ..................................... $(1,237)
Trading ......................................................... (73)
Estimated impact of weather ............................................ (26)
Retail sales decline (excluding weather impact) ................................. (22)
Retail rate increases (Colorado, Minnesota, Texas, New Mexico and Wisconsin) ............ 218
Conservation and DSM revenue and incentive (generally offset by expenses) ............... 74
Non-fuel riders ..................................................... 22
MERP rider ...................................................... 17
2008 refund of nuclear refueling outage revenues due to change in recovery method .......... 16
Transmission revenue ................................................. 14
SPS 2008 fuel cost allocation regulatory accruals ................................ 12
Sales mix and demand revenues .......................................... 4
Other, net ........................................................ 3
Total decrease in electric revenue ........................................ $ (978)
2009 Comparison with 2008 — Electric revenues decreased due to lower fuel and purchased power costs, largely due to
lower customer usage and lower commodity prices, lower trading and weather. This was partially offset by retail rate
increases in Colorado, Minnesota, Texas, New Mexico and Wisconsin, higher conservation and non-fuel rider recovery,
mostly from the RESA rider at PSCO and the RCRF rider at SPS.
2008 vs. 2007
(Millions of Dollars)
Fuel and purchased power cost recovery ..................................... $722
Conservation and non-fuel riders (partially offset in depreciation and amortization expense) ..... 48
Retail rate increases (Wisconsin, North Dakota, Texas interim and New Mexico) ............ 48
Retail sales growth (excluding weather impact) ................................. 30
MERP rider ...................................................... 23
Transmission revenue ................................................. 9
Increased revenue due to leap year (weather normalized impact) ...................... 9
Estimated impact of weather ............................................ (49)
Revenue subject to refund due to change in nuclear refueling outage recovery method ........ (18)
Firm wholesale ..................................................... (10)
Retail customer sales mix .............................................. (8)
Other (including fuel recovery), net ........................................ 31
Total increase in electric revenue ........................................ $835
2008 Comparison with 2007 — Electric revenues increased due to higher fuel and purchased power costs, largely
recovered from customers, higher conservation and non-fuel rider recovery, mostly from the RESA rider at PSCO and
the RES rider at NSP-Minnesota, electric retail rate increases in Wisconsin, North Dakota, Texas and New Mexico and
weather-normalized retail sales growth. Unfavorable weather partially offset the positive variances.
57