Xcel Energy 2009 Annual Report Download - page 124
Download and view the complete annual report
Please find page 124 of the 2009 Xcel Energy annual report below. You can navigate through the pages in the report by either clicking on the pages listed below, or by using the keyword search tool below to find specific information within the annual report.-
 1
1 -
2
-
3
-
4
-
5
-
6
-
7
-
8
-
9
-
10
-
11
-
12
-
13
-
14
-
15
-
16
-
17
-
18
-
19
-
20
-
21
-
22
-
23
-
24
-
25
-
26
-
27
-
28
-
29
-
30
-
31
-
32
-
33
-
34
-
35
-
36
-
37
-
38
-
39
-
40
-
41
-
42
-
43
-
44
-
45
-
46
-
47
-
48
-
49
-
50
-
51
-
52
-
53
-
54
-
55
-
56
-
57
-
58
-
59
-
60
-
61
-
62
-
63
-
64
-
65
-
66
-
67
-
68
-
69
-
70
-
71
-
72
-
73
-
74
-
75
-
76
-
77
-
78
-
79
-
80
-
81
-
82
-
83
-
84
-
85
-
86
-
87
-
88
-
89
-
90
-
91
-
92
-
93
-
94
-
95
-
96
-
97
-
98
-
99
-
100
-
101
-
102
-
103
-
104
-
105
-
106
-
107
-
108
-
109
-
110
-
111
-
112
-
113
-
 114
114 -
 115
115 -
 116
116 -
 117
117 -
 118
118 -
 119
119 -
 120
120 -
 121
121 -
 122
122 -
 123
123 -
 124
124 -
 125
125 -
 126
126 -
 127
127 -
 128
128 -
 129
129 -
 130
130 -
 131
131 -
 132
132 -
 133
133 -
 134
134 -
135
-
136
-
137
-
138
-
139
-
140
-
141
-
142
-
143
-
144
-
145
-
146
-
147
-
148
-
149
-
150
-
151
-
152
-
153
-
154
-
155
-
156
-
157
-
158
-
159
-
160
-
161
-
162
-
163
-
164
-
165
-
166
-
167
-
168
-
169
-
170
-
171
-
172
 |
 |

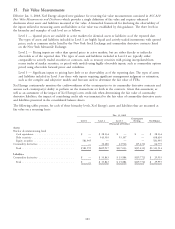
The following table presents, for each of the fair value hierarchy levels, postretirement benefit plan assets that are
measured at fair value as of Dec. 31, 2009:
Level 1 Level 2 Level 3 Total
(Thousands of Dollars)
Cash equivalents ................................... $— $165,291 $ — $165,291
Short term investments ............................... — 2,226 — 2,226
Derivatives ....................................... — 5,937 — 5,937
Government securities ................................ — 1,538 — 1,538
Corporate bonds ................................... — 60,416 — 60,416
Asset-backed & mortgage-backed securities ................... — — 55,371 55,371
Preferred stock ..................................... — 540 — 540
Registered investment companies (mutual funds) ................ — 89,296 — 89,296
Securities lending collateral obligation and other ................ — 4,074 — 4,074
Total ......................................... $— $329,318 $55,371 $384,689
The following table presents the changes in Level 3 postretirement benefit plan assets for the year ended Dec. 31, 2009:
Purchases,
Realized and Issuances, and
Unrealized Settlements
Jan. 1, 2009 Gains (net) Dec. 31, 2009
(Thousands of Dollars)
Asset-backed & mortgage-backed securities ................... $78,693 $4,051 $(27,373) $55,371
Benefit Obligations — A comparison of the actuarially computed benefit obligation and plan assets for Xcel Energy
postretirement health care plans that benefit employees of its utility subsidiaries is presented in the following table:
2009 2008
(Thousands of Dollars)
Change in Projected Benefit Obligation:
Obligation at Jan. 1 .................................................... $794,597 $ 830,315
Service cost ......................................................... 4,665 5,350
Interest cost ......................................................... 50,412 51,047
Medicare subsidy reimbursements ............................................ 3,226 6,178
Plan amendments ...................................................... (27,407) —
Plan participants’ contributions ............................................. 13,786 13,892
Actuarial gain ........................................................ (47,446) (46,827)
Benefit payments ...................................................... (62,931) (65,358)
Obligation at Dec. 31 ................................................... $728,902 $ 794,597
Change in Fair Value of Plan Assets:
Fair value of plan assets at Jan. 1 ............................................ $299,566 $ 427,459
Actual return (loss) return on plan assets ....................................... 72,101 (132,226)
Plan participants’ contributions ............................................. 13,786 13,892
Employer contributions .................................................. 62,167 55,799
Benefit payments ...................................................... (62,931) (65,358)
Fair value of plan assets at Dec. 31 ........................................... $384,689 $ 299,566
Funded Status of Plans at Dec. 31:
Funded status ........................................................ $(344,213) $(495,031)
Current liabilities ...................................................... (2,240) (4,928)
Noncurrent liabilities ................................................... (341,973) (490,103)
Net pension amounts recognized on consolidated balance sheets ......................... $(344,213) $(495,031)
Amounts Not Yet Recognized as Components of Net Periodic Benefit Cost:
Net loss ............................................................ $189,743 $ 305,844
Prior service credit ..................................................... (33,886) (9,205)
Transition obligation .................................................... 44,035 58,479
Total ............................................................. $199,892 $ 355,118
114