Xcel Energy 2009 Annual Report Download - page 68
Download and view the complete annual report
Please find page 68 of the 2009 Xcel Energy annual report below. You can navigate through the pages in the report by either clicking on the pages listed below, or by using the keyword search tool below to find specific information within the annual report.-
 1
1 -
2
-
3
-
4
-
5
-
6
-
7
-
8
-
9
-
10
-
11
-
12
-
13
-
14
-
15
-
16
-
17
-
18
-
19
-
20
-
21
-
22
-
23
-
24
-
25
-
26
-
27
-
28
-
29
-
30
-
31
-
32
-
33
-
34
-
35
-
36
-
37
-
38
-
39
-
40
-
41
-
42
-
43
-
44
-
45
-
46
-
47
-
48
-
49
-
50
-
51
-
52
-
53
-
54
-
55
-
56
-
57
-
 58
58 -
 59
59 -
 60
60 -
 61
61 -
 62
62 -
 63
63 -
 64
64 -
 65
65 -
 66
66 -
 67
67 -
 68
68 -
 69
69 -
 70
70 -
 71
71 -
 72
72 -
 73
73 -
 74
74 -
 75
75 -
 76
76 -
 77
77 -
 78
78 -
79
-
80
-
81
-
82
-
83
-
84
-
85
-
86
-
87
-
88
-
89
-
90
-
91
-
92
-
93
-
94
-
95
-
96
-
97
-
98
-
99
-
100
-
101
-
102
-
103
-
104
-
105
-
106
-
107
-
108
-
109
-
110
-
111
-
112
-
113
-
114
-
115
-
116
-
117
-
118
-
119
-
120
-
121
-
122
-
123
-
124
-
125
-
126
-
127
-
128
-
129
-
130
-
131
-
132
-
133
-
134
-
135
-
136
-
137
-
138
-
139
-
140
-
141
-
142
-
143
-
144
-
145
-
146
-
147
-
148
-
149
-
150
-
151
-
152
-
153
-
154
-
155
-
156
-
157
-
158
-
159
-
160
-
161
-
162
-
163
-
164
-
165
-
166
-
167
-
168
-
169
-
170
-
171
-
172
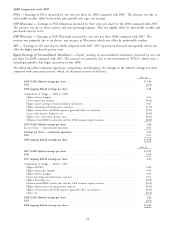
 |
 |

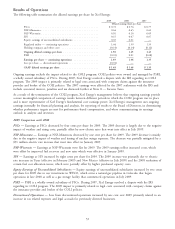
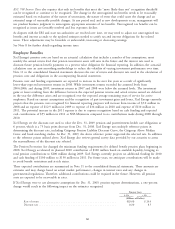
Electric Margin
2009 vs. 2008
(Millions of Dollars)
Retail rate increases (Colorado, Minnesota, Texas, New Mexico and Wisconsin) ............ $218
Conservation and DSM revenue and incentive (partially offset by expenses) ............... 74
Non-fuel riders ..................................................... 22
MERP rider ...................................................... 17
2008 refund of nuclear refueling outage revenues due to change in recovery method .......... 16
NSP-Wisconsin fuel recovery ............................................ 14
SPS 2008 fuel cost allocation regulatory accruals ................................ 12
Firm wholesale ..................................................... 11
Sales mix and demand revenues .......................................... 4
Purchased capacity costs ............................................... (44)
Estimated impact of weather ............................................ (26)
Retail sales decline (excluding weather impact) ................................. (22)
Other, net ........................................................ 2
Total increase in electric margin ......................................... $298
2009 Comparison to 2008 — The increase in electric margin was due to electric rate increases in Colorado, Minnesota,
Texas, New Mexico and Wisconsin, higher conservation and DSM revenue and non-fuel riders. This was partially offset
by higher purchase capacity costs and a negative impact of weather.
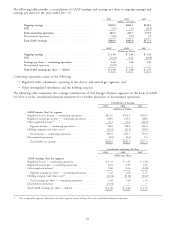
2008 vs. 2007
(Millions of Dollars)
Retail rate increases (Wisconsin, North Dakota, Texas interim and New Mexico) ............ $48
Retail sales growth (excluding weather impact) ................................. 30
Conservation and non-fuel riders ......................................... 28
MERP rider ...................................................... 23
Increased revenue due to leap year (weather normalized impact) ...................... 9
Estimated impact of weather ............................................ (49)
Purchased capacity costs ............................................... (30)
Revenue subject to refund due to change in nuclear refueling outage recovery method ........ (18)
Trading margin .................................................... (10)
Retail customer sales mix .............................................. (8)
Other (including fuel recovery), net ........................................ 1
Total increase in electric margin ......................................... $24
2008 Comparison to 2007 — The increase in electric margin for the year was due to electric rate increases at
Wisconsin, North Dakota, Texas and New Mexico, higher conservation and non-fuel rider revenues and weather-
normalized retail sales growth. These items were partially offset by unfavorable weather and higher purchased power
costs.
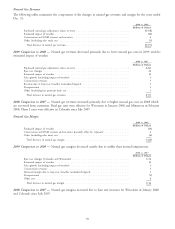
Natural Gas Revenues and Margin
The cost of natural gas tends to vary with changing sales requirements and the unit cost of wholesale natural gas
purchases. However, due to purchased natural gas cost-recovery mechanisms for sales to retail customers, fluctuations in
the wholesale cost of natural gas have little effect on natural gas margin. The following table details the changes in
natural gas revenues and margin.
2009 2008 2007
(Millions of Dollars)
Natural gas revenues .............................. $1,866 $ 2,443 $ 2,112
Cost of natural gas sold and transported ................. (1,266) (1,833) (1,548)
Natural gas margin ............................. $ 600 $ 610 $ 564
58