Xcel Energy 2009 Annual Report Download - page 158
Download and view the complete annual report
Please find page 158 of the 2009 Xcel Energy annual report below. You can navigate through the pages in the report by either clicking on the pages listed below, or by using the keyword search tool below to find specific information within the annual report.-
 1
1 -
2
-
3
-
4
-
5
-
6
-
7
-
8
-
9
-
10
-
11
-
12
-
13
-
14
-
15
-
16
-
17
-
18
-
19
-
20
-
21
-
22
-
23
-
24
-
25
-
26
-
27
-
28
-
29
-
30
-
31
-
32
-
33
-
34
-
35
-
36
-
37
-
38
-
39
-
40
-
41
-
42
-
43
-
44
-
45
-
46
-
47
-
48
-
49
-
50
-
51
-
52
-
53
-
54
-
55
-
56
-
57
-
58
-
59
-
60
-
61
-
62
-
63
-
64
-
65
-
66
-
67
-
68
-
69
-
70
-
71
-
72
-
73
-
74
-
75
-
76
-
77
-
78
-
79
-
80
-
81
-
82
-
83
-
84
-
85
-
86
-
87
-
88
-
89
-
90
-
91
-
92
-
93
-
94
-
95
-
96
-
97
-
98
-
99
-
100
-
101
-
102
-
103
-
104
-
105
-
106
-
107
-
108
-
109
-
110
-
111
-
112
-
113
-
114
-
115
-
116
-
117
-
118
-
119
-
120
-
121
-
122
-
123
-
124
-
125
-
126
-
127
-
128
-
129
-
130
-
131
-
132
-
133
-
134
-
135
-
136
-
137
-
138
-
139
-
140
-
141
-
142
-
143
-
144
-
145
-
146
-
147
-
 148
148 -
 149
149 -
 150
150 -
 151
151 -
 152
152 -
 153
153 -
 154
154 -
 155
155 -
 156
156 -
 157
157 -
 158
158 -
 159
159 -
 160
160 -
 161
161 -
 162
162 -
 163
163 -
 164
164 -
 165
165 -
 166
166 -
 167
167 -
 168
168 -
169
-
170
-
171
-
172
 |
 |

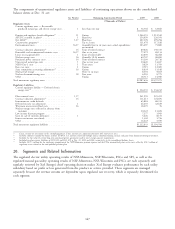
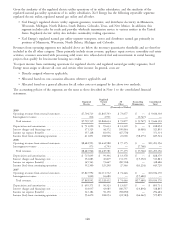
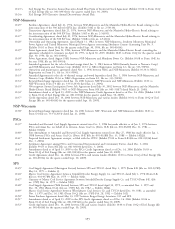
Given the similarity of the regulated electric utility operations of its utility subsidiaries, and the similarity of the
regulated natural gas utility operations of its utility subsidiaries, Xcel Energy has the following reportable segments:
regulated electric utility, regulated natural gas utility and all other.
• Xcel Energy’s regulated electric utility segment generates, transmits, and distributes electricity in Minnesota,
Wisconsin, Michigan, North Dakota, South Dakota, Colorado, Texas, and New Mexico. In addition, this
segment includes sales for resale and provides wholesale transmission service to various entities in the United
States. Regulated electric utility also includes commodity trading operations.
• Xcel Energy’s regulated natural gas utility segment transports, stores and distributes natural gas primarily in
portions of Minnesota, Wisconsin, North Dakota, Michigan and Colorado.
Revenues from operating segments not included above are below the necessary quantitative thresholds and are therefore
included in the all other category. Those primarily include steam revenue, appliance repair services, nonutility real estate
activities, revenues associated with processing solid waste into refuse-derived fuel and investments in rental housing
projects that qualify for low-income housing tax credits.
To report income from continuing operations for regulated electric and regulated natural gas utility segments, Xcel
Energy must assign or allocate all costs and certain other income. In general, costs are:
• Directly assigned wherever applicable;
• Allocated based on cost causation allocators wherever applicable; and
• Allocated based on a general allocator for all other costs not assigned by the above two methods.
The accounting policies of the segments are the same as those described in Note 1 to the consolidated financial
statements.
Regulated
Regulated Natural All Reconciling Consolidated
Electric Gas Other Eliminations Total
(Thousands of Dollars)
2009
Operating revenues from external customers .......... $7,704,723 $1,865,703 $ 73,877 $ — $ 9,644,303
Intersegment revenues ....................... 816 2,931 — (3,747) —
Total revenues ........................... $7,705,539 $1,868,634 $ 73,877 $ (3,747) $ 9,644,303
Depreciation and amortization .................. $ 711,090 $ 95,633 $ 11,329 $ — $ 818,052
Interest charges and financing costs ............... 371,525 44,572 109,844 (4,086) 521,855
Income tax expense (benefit) ................... 357,128 81,956 (67,770) — 371,314
Income (loss) from continuing operations ........... 611,851 108,948 23,000 (58,275) 685,524
2008
Operating revenues from external customers .......... $8,682,993 $2,442,988 $ 77,175 $ — $11,203,156
Intersegment revenues ....................... 973 6,793 — (7,766) —
Total revenues ........................... $8,683,966 $2,449,781 $ 77,175 $ (7,766) $11,203,156
Depreciation and amortization .................. $ 715,695 $ 99,306 $ 13,378 $ — $ 828,379
Interest charges and financing costs ............... 352,083 45,819 131,371 (15,392) 513,881
Income tax expense (benefit) ................... 345,543 73,647 (80,504) — 338,686
Income (loss) from continuing operations ........... 552,300 129,298 27,346 (63,224) 645,720
2007
Operating revenues from external customers .......... $7,847,992 $2,111,732 $ 74,446 $ — $10,034,170
Intersegment revenues ....................... 1,000 16,680 — (17,680) —
Total revenues ........................... $7,848,992 $2,128,412 $ 74,446 $(17,680) $10,034,170
Depreciation and amortization .................. $ 695,571 $ 96,323 $ 13,837 $ — $ 805,731
Interest charges and financing costs ............... 318,937 43,985 180,757 (14,834) 528,845
Income tax expense (benefit) ................... 343,184 50,150 (98,850) — 294,484
Income (loss) from continuing operations ........... 554,670 108,054 (22,583) (64,242) 575,899
148