Xcel Energy 2009 Annual Report Download - page 71
Download and view the complete annual report
Please find page 71 of the 2009 Xcel Energy annual report below. You can navigate through the pages in the report by either clicking on the pages listed below, or by using the keyword search tool below to find specific information within the annual report.-
 1
1 -
2
-
3
-
4
-
5
-
6
-
7
-
8
-
9
-
10
-
11
-
12
-
13
-
14
-
15
-
16
-
17
-
18
-
19
-
20
-
21
-
22
-
23
-
24
-
25
-
26
-
27
-
28
-
29
-
30
-
31
-
32
-
33
-
34
-
35
-
36
-
37
-
38
-
39
-
40
-
41
-
42
-
43
-
44
-
45
-
46
-
47
-
48
-
49
-
50
-
51
-
52
-
53
-
54
-
55
-
56
-
57
-
58
-
59
-
60
-
 61
61 -
 62
62 -
 63
63 -
 64
64 -
 65
65 -
 66
66 -
 67
67 -
 68
68 -
 69
69 -
 70
70 -
 71
71 -
 72
72 -
 73
73 -
 74
74 -
 75
75 -
 76
76 -
 77
77 -
 78
78 -
 79
79 -
 80
80 -
 81
81 -
82
-
83
-
84
-
85
-
86
-
87
-
88
-
89
-
90
-
91
-
92
-
93
-
94
-
95
-
96
-
97
-
98
-
99
-
100
-
101
-
102
-
103
-
104
-
105
-
106
-
107
-
108
-
109
-
110
-
111
-
112
-
113
-
114
-
115
-
116
-
117
-
118
-
119
-
120
-
121
-
122
-
123
-
124
-
125
-
126
-
127
-
128
-
129
-
130
-
131
-
132
-
133
-
134
-
135
-
136
-
137
-
138
-
139
-
140
-
141
-
142
-
143
-
144
-
145
-
146
-
147
-
148
-
149
-
150
-
151
-
152
-
153
-
154
-
155
-
156
-
157
-
158
-
159
-
160
-
161
-
162
-
163
-
164
-
165
-
166
-
167
-
168
-
169
-
170
-
171
-
172
 |
 |
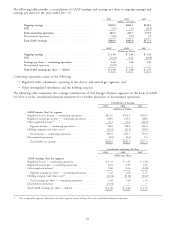
Conservation and DSM Expenses — Conservation and DSM program expenses increased by approximately
$64.4 million for 2009, compared with 2008, and by approximately $15.9 million for 2008, compared with 2007. The
higher expense for 2009 and 2008 was attributable to the expansion of programs and regulatory commitments.
Conservation and DSM program expenses and financial incentives are recovered through riders or base rates.
Depreciation and Amortization — Depreciation and amortization expenses decreased by approximately $10.3 million,
or 1.2 percent, for 2009, compared with 2008. In 2009, NSP-Minnesota began recognizing a 10-year life extension of
the Prairie Island nuclear plant for purposes of determining depreciation, as a result of the MPUC decision in the
Minnesota electric rate case. In addition, in 2009, the MPUC extended the recovery period of decommissioning
expense by 10 years for the Prairie Island and the Monticello nuclear plants. These decisions reduced depreciation and
decommissioning expense in 2009. These decreases were partially offset by normal system expansion.
Depreciation and amortization expenses increased by $22.6 million, or 2.8 percent for 2008 when compared with 2007.
The increase was primarily due to planned system expansion partially offset by a decrease in depreciation due to the
MPUC approval of two NSP-Minnesota depreciation filings in September 2008 and a NDPSC settlement agreement in
December 2008.
Taxes (Other Than Income Taxes) — Taxes (other than income taxes) increased by approximately $19.9 million, or
6.9 percent, for 2009, compared with 2008, and by approximately $8.9 million, or 3.2 percent, for 2008 compared
with 2007. The increase was primarily due to increased property taxes across our jurisdictions.
Other Income, Net — Other income, net, decreased by $30.6 million for 2009 compared with 2008. The net decline
was mainly due to changes in our non-qualified benefit plan liabilities related to market activity, lower interest on under
recovered deferred fuel balances and a decrease in interest received from WYCO for construction deposits.
Other income, net, increased by $33.0 million, for 2008 when compared with 2007. The increase was primarily the
result of PSRI’s termination of the COLI program in 2007, which eliminated certain expenses.
Equity Earnings of Unconsolidated Subsidiaries — Equity earnings of unconsolidated subsidiaries increased by
approximately $21.1 million for 2009, compared with 2008, and by approximately 1.7 million for 2008, compared
with 2007. The increase was primarily due to higher earnings from the equity investment in WYCO as a result of the
High Plains natural gas pipeline, located in Colorado, which commenced operations in late 2008 as well as a gas
storage facility that began operations in July 2009.
Allowance for Funds Used During Construction, Equity and Debt (AFUDC) — AFUDC increased by approximately
$12.9 million, or 12.6 percent for 2009, compared with 2008, and by $30.8 million, or 42.8 percent, for 2008 when
compared with 2007. The increase was due primarily to the construction of Comanche Unit 3, a power facility located
in Colorado, as well as other construction projects.
Interest Charges — Interest charges increased by approximately $8.7 million, or 1.6 percent, for 2009, compared with
2008. The increase was primarily the result of increased debt levels to fund new capital investments, partially offset by
lower interest rates on short-term debt.
Interest charges increased by $33 million, or 6.3 percent, for 2008 when compared with 2007. The increase was
primarily the result of increased debt levels to fund Xcel Energy’s rate base growth strategy.
Income Taxes — Income tax expense for continuing operations increased by $32.6 million for 2009, compared with
2008. The increase in income tax expense was primarily due to an increase in pretax income. The ETR for continuing
operations was 35.1 percent for 2009, compared with 34.4 percent for 2008. The higher ETR for 2009 was primarily
due to the establishment of a valuation allowance against certain state tax credit carryovers that are now expected to
expire prior to full utilization. Excluding this item, the ETR for 2009 would have been 34.6 percent.
Income taxes for continuing operations increased by $44.2 million for 2008, compared with 2007. The increase in
income tax expense was primarily due to an increase in pretax income in 2008. The ETR for continuing operations was
34.4 percent for 2008, compared with 33.8 percent for 2007.
The ETRs for 2009 and 2008 differ from their statutory federal income tax rates, primarily due to state income tax
expense partially offset by tax credits recognized and tax benefit from plant related regulatory differences. The ETR for
2007 differs from its statutory federal income tax rate, primarily due to state income tax expense partially offset by tax
credits recognized and tax benefits from life insurance policies and plant related regulatory differences. See Note 8 to
the consolidated financial statements.
61