Xcel Energy 2009 Annual Report Download - page 157
Download and view the complete annual report
Please find page 157 of the 2009 Xcel Energy annual report below. You can navigate through the pages in the report by either clicking on the pages listed below, or by using the keyword search tool below to find specific information within the annual report.-
 1
1 -
2
-
3
-
4
-
5
-
6
-
7
-
8
-
9
-
10
-
11
-
12
-
13
-
14
-
15
-
16
-
17
-
18
-
19
-
20
-
21
-
22
-
23
-
24
-
25
-
26
-
27
-
28
-
29
-
30
-
31
-
32
-
33
-
34
-
35
-
36
-
37
-
38
-
39
-
40
-
41
-
42
-
43
-
44
-
45
-
46
-
47
-
48
-
49
-
50
-
51
-
52
-
53
-
54
-
55
-
56
-
57
-
58
-
59
-
60
-
61
-
62
-
63
-
64
-
65
-
66
-
67
-
68
-
69
-
70
-
71
-
72
-
73
-
74
-
75
-
76
-
77
-
78
-
79
-
80
-
81
-
82
-
83
-
84
-
85
-
86
-
87
-
88
-
89
-
90
-
91
-
92
-
93
-
94
-
95
-
96
-
97
-
98
-
99
-
100
-
101
-
102
-
103
-
104
-
105
-
106
-
107
-
108
-
109
-
110
-
111
-
112
-
113
-
114
-
115
-
116
-
117
-
118
-
119
-
120
-
121
-
122
-
123
-
124
-
125
-
126
-
127
-
128
-
129
-
130
-
131
-
132
-
133
-
134
-
135
-
136
-
137
-
138
-
139
-
140
-
141
-
142
-
143
-
144
-
145
-
146
-
 147
147 -
 148
148 -
 149
149 -
 150
150 -
 151
151 -
 152
152 -
 153
153 -
 154
154 -
 155
155 -
 156
156 -
 157
157 -
 158
158 -
 159
159 -
 160
160 -
 161
161 -
 162
162 -
 163
163 -
 164
164 -
 165
165 -
 166
166 -
 167
167 -
168
-
169
-
170
-
171
-
172
 |
 |

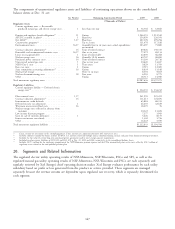
The components of unamortized regulatory assets and liabilities of continuing operations shown on the consolidated
balance sheets at Dec. 31 are:
See Note(s) Remaining Amortization Period 2009 2008
(Thousands of Dollars)
Regulatory Assets
Current regulatory asset — Recoverable
purchased natural gas and electric energy costs . . 1 Less than one year $ 56,744 $ 32,843
Pension and employee benefit obligations(e) ..... 11 Various 1,206,555 1,212,542
AFUDC recorded in plant(a) .............. 1 Plant lives 254,630 220,354
Net AROs(b) ....................... 1,17 Plant lives 207,309 299,294
Conservation programs(a) ................ Up to 2 years 121,678 117,188
Environmental costs ................... 16,17 Generally four to six years once actual expenditures 103,297 75,880
are incurred
Contract valuation adjustments(c) ........... 14 Term of related contract 89,026 150,723
Renewable and environmental initiative costs .... 16,17 One to six years 77,072 69,134
Losses on reacquired debt ............... 1 Term of related debt 62,005 66,268
Nuclear outage costs .................. 16 Generally 18-24 months 60,747 40,690
Purchased power contracts costs ............ 14 Term of related contract 33,203 20,716
Unrecovered natural gas costs ............. 1 One to two years 10,620 14,657
MISO Day 2 costs ................... 1 Three years 9,829 11,783
Rate case costs ...................... 1 Various 9,519 12,085
State commission accounting adjustments(a) ..... 16 Various 8,839 13,148
Nuclear fuel storage ................... Three to six years 8,301 9,652
Nuclear decommissioning costs ............ 18 Two years 6,293 8,775
Other ........................... Various 18,713 14,390
Total noncurrent regulatory assets ............ $2,287,636 $2,357,279
Regulatory Liabilities
Current regulatory liability — Deferred electric
energy costs(d) ..................... $ 124,335 $ 134,212
Plant removal costs ................... 1,17 941,959 925,472
Contract valuation adjustments(c) ........... 14 111,413 124,676
Investment tax credit deferrals ............. 65,884 68,313
Deferred income tax adjustment ............ 1 46,435 42,619
Wisconsin overrecovered fuel costs .......... 16 18,493 76
Nuclear outage costs collected in advance from
customers ....................... 10,322 13,678
Low income discount program ............ 7,177 3,943
Gain on sale of emission allowances ......... 1 3,426 8,153
Interest on income tax refunds ............ 1,302 1,736
Other ........................... 16,422 5,930
Total noncurrent regulatory liabilities .......... $1,222,833 $1,194,596
(a) Earns a return on investment in the ratemaking process. These amounts are amortized consistent with recovery in rates.
(b) Includes amounts recorded for future recovery of AROs, less amounts recovered through nuclear decommissioning accruals and gains from decommissioning investments.
(c) Includes the fair value of certain long-term purchased power agreements used to meet energy capacity requirements.
(d) Included in other current liabilities of $350,318 and $331,419 at Dec. 31, 2009 and 2008, respectively, in the consolidated balance sheets.
(e) Includes $415.5 million for the regulatory recognition of the NSP-Minnesota pension expense and the PSCo unamortized prior service costs, offset by $18.1 million of
regulatory assets related to the non-qualified pension plan.
20. Segments and Related Information
The regulated electric utility operating results of NSP-Minnesota, NSP-Wisconsin, PSCo and SPS, as well as the
regulated natural gas utility operating results of NSP-Minnesota, NSP-Wisconsin and PSCo are each separately and
regularly reviewed by Xcel Energy’s chief operating decision maker. Xcel Energy evaluates performance by each utility
subsidiary based on profit or loss generated from the product or service provided. These segments are managed
separately because the revenue streams are dependent upon regulated rate recovery, which is separately determined for
each segment.
147