Xcel Energy 2009 Annual Report Download - page 128
Download and view the complete annual report
Please find page 128 of the 2009 Xcel Energy annual report below. You can navigate through the pages in the report by either clicking on the pages listed below, or by using the keyword search tool below to find specific information within the annual report.-
 1
1 -
2
-
3
-
4
-
5
-
6
-
7
-
8
-
9
-
10
-
11
-
12
-
13
-
14
-
15
-
16
-
17
-
18
-
19
-
20
-
21
-
22
-
23
-
24
-
25
-
26
-
27
-
28
-
29
-
30
-
31
-
32
-
33
-
34
-
35
-
36
-
37
-
38
-
39
-
40
-
41
-
42
-
43
-
44
-
45
-
46
-
47
-
48
-
49
-
50
-
51
-
52
-
53
-
54
-
55
-
56
-
57
-
58
-
59
-
60
-
61
-
62
-
63
-
64
-
65
-
66
-
67
-
68
-
69
-
70
-
71
-
72
-
73
-
74
-
75
-
76
-
77
-
78
-
79
-
80
-
81
-
82
-
83
-
84
-
85
-
86
-
87
-
88
-
89
-
90
-
91
-
92
-
93
-
94
-
95
-
96
-
97
-
98
-
99
-
100
-
101
-
102
-
103
-
104
-
105
-
106
-
107
-
108
-
109
-
110
-
111
-
112
-
113
-
114
-
115
-
116
-
117
-
 118
118 -
 119
119 -
 120
120 -
 121
121 -
 122
122 -
 123
123 -
 124
124 -
 125
125 -
 126
126 -
 127
127 -
 128
128 -
 129
129 -
 130
130 -
 131
131 -
 132
132 -
 133
133 -
 134
134 -
 135
135 -
 136
136 -
 137
137 -
 138
138 -
139
-
140
-
141
-
142
-
143
-
144
-
145
-
146
-
147
-
148
-
149
-
150
-
151
-
152
-
153
-
154
-
155
-
156
-
157
-
158
-
159
-
160
-
161
-
162
-
163
-
164
-
165
-
166
-
167
-
168
-
169
-
170
-
171
-
172
 |
 |

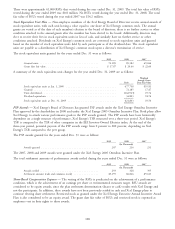
Dec. 31, 2009
Derivative
Counterparty Instruments
Fair Value Netting(a) Valuation
(Thousands of Dollars)
Current derivative liabilities
Derivatives designated as cash flow hedges:
Vehicle fuel and other commodity ................................. $ 3,604 $ — $ 3,604
Other derivative instruments:
Trading commodity .......................................... 22,370 (18,095) 4,275
Electric commodity ........................................... 3,276 1,425 4,701
Natural gas commodity ........................................ 6,749 165 6,914
32,395 (16,505) 15,890
Total current derivative liabilities ................................. $35,999 $(16,505) $19,494
Noncurrent derivative liabilities
Other derivative instruments:
Trading commodity .......................................... 13,066 (3,521) 9,545
Natural gas commodity ........................................ 662 254 916
Total noncurrent derivative liabilities .............................. $13,728 $ (3,267) $10,461
(a) ASC 815 Derivatives and Hedging permits the netting of receivables and payables for derivatives and related collateral amounts when a legally
enforceable master netting agreement exists between Xcel Energy and a counterparty. A master netting agreement is an agreement between two parties
who have multiple contracts with each other that provides for the net settlement of all contracts in the event of default on or termination of any one
contract.
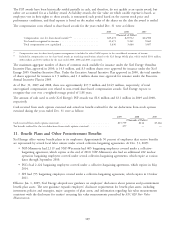
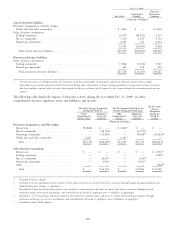
The following table details the impact of derivative activity during the year ended Dec. 31, 2009, on other
comprehensive income, regulatory assets and liabilities, and income:
Pre-Tax Gains
Fair Value Changes Recognized Pre-Tax Amounts Reclassified into (Losses)
During the Period in: Income During the Period from: Recognized
Other Regulatory Other Regulatory During the
Comprehensive Assets and Comprehensive Assets and Period in
Income (Loss) Liabilities Income Liabilities Income
(Thousands of Dollars)
Derivatives designated as cash flow hedges
Interest rate .......................... $(3,840) $ — $ 6,064(a) $— $ —
Electric commodity ...................... — (18,599) — (4,755)(c) —
Natural gas commodity ................... — (15,830) — 78,488(d) (30,241)(d)
Vehicle fuel and other commodity ............ 2,287 — 6,391(e) ——
Total ............................. $(1,553) $(34,429) $12,455 $73,733 $(30,241)
Other derivative instruments
Interest rate .......................... $ — $ — $ — $ — $ 2,503(a)
Trading commodity ..................... ————9,866(b)
Electric commodity ...................... — 20,607 — (343)(c) —
Natural gas commodity ................... — 3,962 — 9,307(d) —
Other ..............................————(160)(b)
Total ............................. $ — $24,569 $ — $ 8,964 $ 12,209
(a) Recorded to interest charges.
(b) Recorded to electric operating revenues. Portions of these gains and losses are shared with electric customers through margin-sharing mechanisms and
deducted from gross revenue, as appropriate.
(c) Recorded to electric fuel and purchased power; these derivative settlement gains and losses are shared with electric customers through fuel and
purchased energy cost-recovery mechanisms, and reclassified out of income as regulatory assets or liabilities, as appropriate.
(d) Recorded to cost of natural gas sold and transported; these derivative settlement gains and losses are shared with natural gas customers through
purchased natural gas cost-recovery mechanisms, and reclassified out of income as regulatory assets or liabilities, as appropriate.
(e) Recorded to other O&M expenses.
118