Xcel Energy 2009 Annual Report Download - page 56
Download and view the complete annual report
Please find page 56 of the 2009 Xcel Energy annual report below. You can navigate through the pages in the report by either clicking on the pages listed below, or by using the keyword search tool below to find specific information within the annual report.-
 1
1 -
2
-
3
-
4
-
5
-
6
-
7
-
8
-
9
-
10
-
11
-
12
-
13
-
14
-
15
-
16
-
17
-
18
-
19
-
20
-
21
-
22
-
23
-
24
-
25
-
26
-
27
-
28
-
29
-
30
-
31
-
32
-
33
-
34
-
35
-
36
-
37
-
38
-
39
-
40
-
41
-
42
-
43
-
44
-
45
-
 46
46 -
 47
47 -
 48
48 -
 49
49 -
 50
50 -
 51
51 -
 52
52 -
 53
53 -
 54
54 -
 55
55 -
 56
56 -
 57
57 -
 58
58 -
 59
59 -
 60
60 -
 61
61 -
 62
62 -
 63
63 -
 64
64 -
 65
65 -
 66
66 -
67
-
68
-
69
-
70
-
71
-
72
-
73
-
74
-
75
-
76
-
77
-
78
-
79
-
80
-
81
-
82
-
83
-
84
-
85
-
86
-
87
-
88
-
89
-
90
-
91
-
92
-
93
-
94
-
95
-
96
-
97
-
98
-
99
-
100
-
101
-
102
-
103
-
104
-
105
-
106
-
107
-
108
-
109
-
110
-
111
-
112
-
113
-
114
-
115
-
116
-
117
-
118
-
119
-
120
-
121
-
122
-
123
-
124
-
125
-
126
-
127
-
128
-
129
-
130
-
131
-
132
-
133
-
134
-
135
-
136
-
137
-
138
-
139
-
140
-
141
-
142
-
143
-
144
-
145
-
146
-
147
-
148
-
149
-
150
-
151
-
152
-
153
-
154
-
155
-
156
-
157
-
158
-
159
-
160
-
161
-
162
-
163
-
164
-
165
-
166
-
167
-
168
-
169
-
170
-
171
-
172
 |
 |

23FEB201019411094
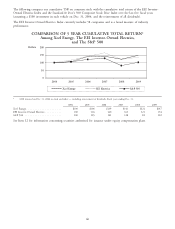
The following compares our cumulative TSR on common stock with the cumulative total return of the EEI Investor-
Owned Electrics Index and the Standard & Poor’s 500 Composite Stock Price Index over the last five fiscal years
(assuming a $100 investment in each vehicle on Dec. 31, 2004, and the reinvestment of all dividends).
The EEI Investor-Owned Electrics Index currently includes 58 companies and is a broad measure of industry
performance.
COMPARISON OF 5 YEAR CUMULATIVE TOTAL RETURN*
Among Xcel Energy, The EEI Investor-Owned Electrics,
and The S&P 500
0
50
100
150
200
20092004 2005 2006 2007 2008
Dollars
Xcel Energy EEI Electrics S&P 500
* $100 invested on Dec. 31, 2004 in stock and index — including reinvestment of dividends. Fiscal years ending Dec. 31.
2004 2005 2006 2007 2008 2009
Xcel Energy ..................... $100 $106 $139 $141 $122 $147
EEI Investor-Owned Electrics .......... 100 116 140 163 121 134
S&P 500 ...................... 100 105 121 128 81 102
See Item 12 for information concerning securities authorized for issuance under equity compensation plans.
46