Xcel Energy 2009 Annual Report Download - page 168
Download and view the complete annual report
Please find page 168 of the 2009 Xcel Energy annual report below. You can navigate through the pages in the report by either clicking on the pages listed below, or by using the keyword search tool below to find specific information within the annual report.-
 1
1 -
2
-
3
-
4
-
5
-
6
-
7
-
8
-
9
-
10
-
11
-
12
-
13
-
14
-
15
-
16
-
17
-
18
-
19
-
20
-
21
-
22
-
23
-
24
-
25
-
26
-
27
-
28
-
29
-
30
-
31
-
32
-
33
-
34
-
35
-
36
-
37
-
38
-
39
-
40
-
41
-
42
-
43
-
44
-
45
-
46
-
47
-
48
-
49
-
50
-
51
-
52
-
53
-
54
-
55
-
56
-
57
-
58
-
59
-
60
-
61
-
62
-
63
-
64
-
65
-
66
-
67
-
68
-
69
-
70
-
71
-
72
-
73
-
74
-
75
-
76
-
77
-
78
-
79
-
80
-
81
-
82
-
83
-
84
-
85
-
86
-
87
-
88
-
89
-
90
-
91
-
92
-
93
-
94
-
95
-
96
-
97
-
98
-
99
-
100
-
101
-
102
-
103
-
104
-
105
-
106
-
107
-
108
-
109
-
110
-
111
-
112
-
113
-
114
-
115
-
116
-
117
-
118
-
119
-
120
-
121
-
122
-
123
-
124
-
125
-
126
-
127
-
128
-
129
-
130
-
131
-
132
-
133
-
134
-
135
-
136
-
137
-
138
-
139
-
140
-
141
-
142
-
143
-
144
-
145
-
146
-
147
-
148
-
149
-
150
-
151
-
152
-
153
-
154
-
155
-
156
-
157
-
 158
158 -
 159
159 -
 160
160 -
 161
161 -
 162
162 -
 163
163 -
 164
164 -
 165
165 -
 166
166 -
 167
167 -
 168
168 -
 169
169 -
 170
170 -
 171
171 -
 172
172
 |
 |

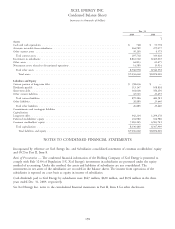
XCEL ENERGY INC.
Condensed Balance Sheets
(amounts in thousands of dollars)
Dec. 31
2009 2008
’]
Assets
Cash and cash equivalents .............................................. $ 748 $ 51,778
Accounts receivable from subsidiaries ........................................ 264,789 275,077
Other current assets .................................................. 30,165 6,573
Total current assets ................................................. 295,702 333,428
Investment in subsidiaries .............................................. 8,861,560 8,465,003
Other assets ....................................................... 64,813 61,675
Noncurrent assets related to discontinued operations .............................. 14,585 15,914
Total other assets .................................................. 8,940,958 8,542,592
Total assets .................................................... $9,236,660 $8,876,020
Liabilities and Equity
Current portion of long-term debt ......................................... $ 358,636 $ —
Dividends payable ................................................... 113,147 108,838
Short-term debt ..................................................... 364,000 350,250
Other current liabilities ................................................ 43,503 23,493
Total current liabilities ............................................... 879,286 482,581
Other liabilities ..................................................... 26,885 25,440
Total other liabilities ................................................ 26,885 25,440
Commitments and contingent liabilities
Capitalization
Long-term debt ..................................................... 942,264 1,299,278
Preferred stockholders’ equity ............................................ 104,980 104,980
Common stockholders’ equity ............................................ 7,283,245 6,963,741
Total capitalization ................................................. 8,330,489 8,367,999
Total liabilities and equity ........................................... $9,236,660 $8,876,020
NOTES TO CONDENSED FINANCIAL STATEMENTS
Incorporated by reference are Xcel Energy Inc. and Subsidiaries consolidated statements of common stockholders’ equity
and OCI in Part II, Item 8.
Basis of Presentation — The condensed financial information of the Holding Company of Xcel Energy is presented to
comply with Rule 12-04 of Regulation S-X. Xcel Energy’s investments in subsidiaries are presented under the equity
method of accounting. Under this method, the assets and liabilities of subsidiaries are not consolidated. The
investments in net assets of the subsidiaries are recorded in the balance sheets. The income from operations of the
subsidiaries is reported on a net basis as equity in income of subsidiaries.
Cash dividends paid to Xcel Energy by subsidiaries were $647 million, $630 million, and $694 million in the three
years ended Dec. 31, 2009, respectively.
See Xcel Energy Inc. notes to the consolidated financial statements in Part II, Item 8 for other disclosures.
158