Xcel Energy 2009 Annual Report Download - page 127
Download and view the complete annual report
Please find page 127 of the 2009 Xcel Energy annual report below. You can navigate through the pages in the report by either clicking on the pages listed below, or by using the keyword search tool below to find specific information within the annual report.-
 1
1 -
2
-
3
-
4
-
5
-
6
-
7
-
8
-
9
-
10
-
11
-
12
-
13
-
14
-
15
-
16
-
17
-
18
-
19
-
20
-
21
-
22
-
23
-
24
-
25
-
26
-
27
-
28
-
29
-
30
-
31
-
32
-
33
-
34
-
35
-
36
-
37
-
38
-
39
-
40
-
41
-
42
-
43
-
44
-
45
-
46
-
47
-
48
-
49
-
50
-
51
-
52
-
53
-
54
-
55
-
56
-
57
-
58
-
59
-
60
-
61
-
62
-
63
-
64
-
65
-
66
-
67
-
68
-
69
-
70
-
71
-
72
-
73
-
74
-
75
-
76
-
77
-
78
-
79
-
80
-
81
-
82
-
83
-
84
-
85
-
86
-
87
-
88
-
89
-
90
-
91
-
92
-
93
-
94
-
95
-
96
-
97
-
98
-
99
-
100
-
101
-
102
-
103
-
104
-
105
-
106
-
107
-
108
-
109
-
110
-
111
-
112
-
113
-
114
-
115
-
116
-
 117
117 -
 118
118 -
 119
119 -
 120
120 -
 121
121 -
 122
122 -
 123
123 -
 124
124 -
 125
125 -
 126
126 -
 127
127 -
 128
128 -
 129
129 -
 130
130 -
 131
131 -
 132
132 -
 133
133 -
 134
134 -
 135
135 -
 136
136 -
 137
137 -
138
-
139
-
140
-
141
-
142
-
143
-
144
-
145
-
146
-
147
-
148
-
149
-
150
-
151
-
152
-
153
-
154
-
155
-
156
-
157
-
158
-
159
-
160
-
161
-
162
-
163
-
164
-
165
-
166
-
167
-
168
-
169
-
170
-
171
-
172
 |
 |

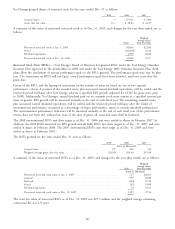
The following table shows the major components of derivative instruments valuation in the consolidated balance sheets:
Dec. 31, 2009 Dec. 31, 2008
Derivative Derivative Derivative Derivative
Instruments Instruments Instruments Instruments
Valuation – Valuation – Valuation – Valuation –
Assets Liabilities Assets Liabilities
(Thousands of Dollars)
Long-term purchased power agreements ............. $322,455 $324,369 $374,692 $353,531
Commodity derivatives ....................... 64,775 29,955 52,968 54,307
Interest rate derivatives ....................... — — — 8,503
Total ................................. $387,230 $354,324 $427,660 $416,341
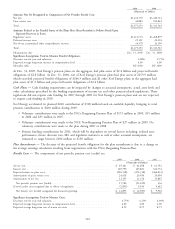
In 2003, as a result of implementing new guidance on the normal purchase exception for derivative accounting
contained in ASC 815 Derivatives and Hedging, Xcel Energy began recording several long-term purchased power
agreements at fair value due to accounting requirements related to underlying price adjustments. As these purchases are
recovered through normal regulatory recovery mechanisms in the respective jurisdictions, the changes in fair value for
these contracts were offset by regulatory assets and liabilities. During 2006, Xcel Energy qualified these contracts under
the normal purchase exception. Based on this qualification, the contracts are no longer adjusted to fair value and the
previous carrying value of these contracts will be amortized over the remaining contract lives along with the offsetting
regulatory assets and liabilities.
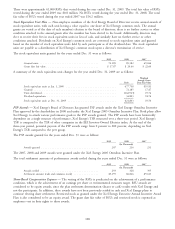
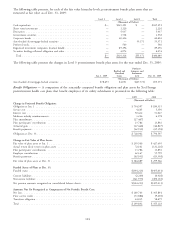
Financial Impact of Qualifying Cash Flow Hedges — The impact of qualifying interest rate and vehicle fuel cash flow
hedges on Xcel Energy’s accumulated other comprehensive income, included in the consolidated statements of common
stockholders’ equity and comprehensive income, is detailed in the following table:
2009 2008 2007
(Thousands of Dollars)
Accumulated other comprehensive (loss) income related to cash flow hedges at Jan. 1 . . . $(13,113) $ (1,416) $ 2,195
After-tax net unrealized losses related to derivatives accounted for as hedges ......... (710) (12,083) (2,628)
After-tax net realized losses (gains) on derivative transactions reclassified into earnings . . . 7,388 386 (983)
Accumulated other comprehensive loss related to cash flow hedges at Dec. 31 ........ $(6,435) $(13,113) $(1,416)
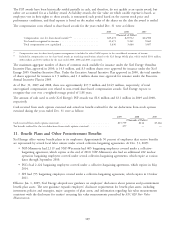
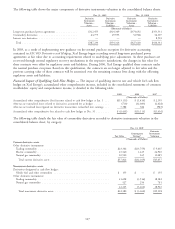
The following table details the fair value of commodity derivatives recorded to derivative instruments valuation in the
consolidated balance sheet, by category:
Dec. 31, 2009
Derivative
Counterparty Instruments
Fair Value Netting(a) Valuation
(Thousands of Dollars)
Current derivative assets
Other derivative instruments:
Trading commodity .......................................... $23,366 $(13,759) $ 9,607
Electric commodity ........................................... 23,540 1,425 24,965
Natural gas commodity ........................................ 10,920 165 11,085
Total current derivative assets ................................... $57,826 $(12,169) $45,657
Noncurrent derivative assets
Derivatives designated as cash flow hedges:
Vehicle fuel and other commodity ................................. $ 155 $ — $ 155
Other derivative instruments:
Trading commodity .......................................... 21,698 (3,516) 18,182
Natural gas commodity ........................................ 527 254 781
22,225 (3,262) 18,963
Total noncurrent derivative assets ................................ $22,380 $ (3,262) $19,118
117