Xcel Energy 2009 Annual Report Download - page 131
Download and view the complete annual report
Please find page 131 of the 2009 Xcel Energy annual report below. You can navigate through the pages in the report by either clicking on the pages listed below, or by using the keyword search tool below to find specific information within the annual report.-
 1
1 -
2
-
3
-
4
-
5
-
6
-
7
-
8
-
9
-
10
-
11
-
12
-
13
-
14
-
15
-
16
-
17
-
18
-
19
-
20
-
21
-
22
-
23
-
24
-
25
-
26
-
27
-
28
-
29
-
30
-
31
-
32
-
33
-
34
-
35
-
36
-
37
-
38
-
39
-
40
-
41
-
42
-
43
-
44
-
45
-
46
-
47
-
48
-
49
-
50
-
51
-
52
-
53
-
54
-
55
-
56
-
57
-
58
-
59
-
60
-
61
-
62
-
63
-
64
-
65
-
66
-
67
-
68
-
69
-
70
-
71
-
72
-
73
-
74
-
75
-
76
-
77
-
78
-
79
-
80
-
81
-
82
-
83
-
84
-
85
-
86
-
87
-
88
-
89
-
90
-
91
-
92
-
93
-
94
-
95
-
96
-
97
-
98
-
99
-
100
-
101
-
102
-
103
-
104
-
105
-
106
-
107
-
108
-
109
-
110
-
111
-
112
-
113
-
114
-
115
-
116
-
117
-
118
-
119
-
120
-
 121
121 -
 122
122 -
 123
123 -
 124
124 -
 125
125 -
 126
126 -
 127
127 -
 128
128 -
 129
129 -
 130
130 -
 131
131 -
 132
132 -
 133
133 -
 134
134 -
 135
135 -
 136
136 -
 137
137 -
 138
138 -
 139
139 -
 140
140 -
 141
141 -
142
-
143
-
144
-
145
-
146
-
147
-
148
-
149
-
150
-
151
-
152
-
153
-
154
-
155
-
156
-
157
-
158
-
159
-
160
-
161
-
162
-
163
-
164
-
165
-
166
-
167
-
168
-
169
-
170
-
171
-
172
 |
 |

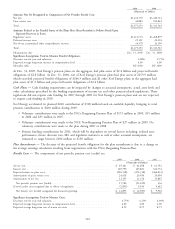
15. Fair Value Measurements
Effective Jan. 1, 2008, Xcel Energy adopted new guidance for recurring fair value measurements contained in ASC 820
Fair Value Measurements and Disclosures which provides a single definition of fair value and requires enhanced
disclosures about assets and liabilities measured at fair value. A hierarchal framework for disclosing the observability of
the inputs utilized in measuring assets and liabilities at fair value was established by this guidance. The three levels in
the hierarchy and examples of each level are as follows:
Level 1 — Quoted prices are available in active markets for identical assets or liabilities as of the reported date.
The types of assets and liabilities included in Level 1 are highly liquid and actively traded instruments with quoted
prices, such as common stocks listed by the New York Stock Exchange and commodity derivative contracts listed
on the New York Mercantile Exchange.
Level 2 — Pricing inputs are other than quoted prices in active markets, but are either directly or indirectly
observable as of the reported date. The types of assets and liabilities included in Level 2 are typically either
comparable to actively traded securities or contracts, such as treasury securities with pricing interpolated from
recent trades of similar securities, or priced with models using highly observable inputs, such as commodity options
priced using observable forward prices and volatilities.
Level 3 — Significant inputs to pricing have little or no observability as of the reporting date. The types of assets
and liabilities included in Level 3 are those with inputs requiring significant management judgment or estimation,
such as the complex and subjective models and forecasts used to determine the fair value of FTRs.
Xcel Energy continuously monitors the creditworthiness of the counterparties to its commodity derivative contracts and
assesses each counterparty’s ability to perform on the transactions set forth in the contracts. Given this assessment, as
well as an assessment of the impact of Xcel Energy’s own credit risk when determining the fair value of commodity
derivative liabilities, the impact of considering credit risk was immaterial to the fair value of commodity derivative assets
and liabilities presented in the consolidated balance sheets.
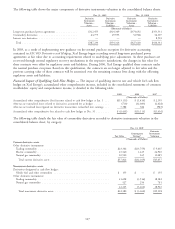
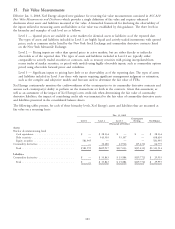
The following tables present, for each of these hierarchy levels, Xcel Energy’s assets and liabilities that are measured at
fair value on a recurring basis:
Dec. 31, 2009
Counterparty
Level 1 Level 2 Level 3 Netting Net Balance
(Thousands of Dollars)
Assets
Nuclear decommissioning fund
Cash equivalents ....................... $ — $ 28,134 $ — $ — $ 28,134
Debt securities ......................... — 545,503 93,107 — 638,610
Equity securities ........................ 581,995 — — — 581,995
Commodity derivatives ..................... — 36,280 43,926 (15,431) 64,775
Total ............................... $581,995 $609,917 $137,033 $(15,431) $1,313,514
Liabilities
Commodity derivatives ..................... $ — $ 33,843 $ 15,884 $(19,772) $ 29,955
Total ............................... $ — $33,843 $ 15,884 $(19,772) $ 29,955
121