Xcel Energy 2009 Annual Report Download - page 81
Download and view the complete annual report
Please find page 81 of the 2009 Xcel Energy annual report below. You can navigate through the pages in the report by either clicking on the pages listed below, or by using the keyword search tool below to find specific information within the annual report.-
 1
1 -
2
-
3
-
4
-
5
-
6
-
7
-
8
-
9
-
10
-
11
-
12
-
13
-
14
-
15
-
16
-
17
-
18
-
19
-
20
-
21
-
22
-
23
-
24
-
25
-
26
-
27
-
28
-
29
-
30
-
31
-
32
-
33
-
34
-
35
-
36
-
37
-
38
-
39
-
40
-
41
-
42
-
43
-
44
-
45
-
46
-
47
-
48
-
49
-
50
-
51
-
52
-
53
-
54
-
55
-
56
-
57
-
58
-
59
-
60
-
61
-
62
-
63
-
64
-
65
-
66
-
67
-
68
-
69
-
70
-
 71
71 -
 72
72 -
 73
73 -
 74
74 -
 75
75 -
 76
76 -
 77
77 -
 78
78 -
 79
79 -
 80
80 -
 81
81 -
 82
82 -
 83
83 -
 84
84 -
 85
85 -
 86
86 -
 87
87 -
 88
88 -
 89
89 -
 90
90 -
 91
91 -
92
-
93
-
94
-
95
-
96
-
97
-
98
-
99
-
100
-
101
-
102
-
103
-
104
-
105
-
106
-
107
-
108
-
109
-
110
-
111
-
112
-
113
-
114
-
115
-
116
-
117
-
118
-
119
-
120
-
121
-
122
-
123
-
124
-
125
-
126
-
127
-
128
-
129
-
130
-
131
-
132
-
133
-
134
-
135
-
136
-
137
-
138
-
139
-
140
-
141
-
142
-
143
-
144
-
145
-
146
-
147
-
148
-
149
-
150
-
151
-
152
-
153
-
154
-
155
-
156
-
157
-
158
-
159
-
160
-
161
-
162
-
163
-
164
-
165
-
166
-
167
-
168
-
169
-
170
-
171
-
172
 |
 |

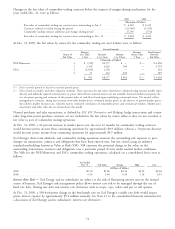
Changes in the fair value of commodity trading contracts before the impacts of margin-sharing mechanisms for the
years ended Dec. 31, were as follows:
2009 2008
(Thousands of Dollars)
Fair value of commodity trading net contract assets outstanding at Jan. 1 ......... $ 4,169 $ 6,315
Contracts realized or settled during the period .......................... (21,740) (1,574)
Commodity trading contract additions and changes during period ............. 27,199 (572)
Fair value of commodity trading net contract assets outstanding at Dec. 31 ........ $ 9,628 $ 4,169
At Dec. 31, 2009, the fair values by source for the commodity trading net asset balance were as follows:
Futures/Forwards
Maturity Maturity Total Futures/
Source of Less Than Maturity Maturity Greater Than Forwards
Fair Value 1 Year 1 to 3 Years 4 to 5 Years 5 Years Fair Value
(Thousands of Dollars)
NSP-Minnesota ................ 1 $ (319) $2,577 $ — $ — $ 2,258
2 2,338 4,220 160 — 6,718
PSCo ...................... 1 (1,055) 1,158 — — 103
2 31 222 296 — 549
$ 995 $8,177 $ 456 $ — $ 9,628
1— Prices actively quoted or based on actively quoted prices.
2— Prices based on models and other valuation methods. These represent the fair value of positions calculated using internal models when
directly and indirectly quoted external prices or prices derived from external sources are not available. Internal models incorporate the
use of options pricing and estimates of the present value of cash flows based upon underlying contractual terms. The models reflect
management’s estimates, taking into account observable market prices, estimated market prices in the absence of quoted market prices,
the risk-free market discount rate, volatility factors, estimated correlations of commodity prices and contractual volumes. Market price
uncertainty and other risks also are factored into the model.
Normal purchases and sales transactions, as defined by ASC 815 Derivatives and Hedging, hedge transactions and certain
other long-term power purchase contracts are not included in the fair values by source tables as they are not recorded at
fair value as part of commodity trading operations.
At Dec. 31, 2009, a 10 percent increase in market prices over the next 12 months for commodity trading contracts
would decrease pretax income from continuing operations by approximately $0.9 million, whereas a 10 percent decrease
would increase pretax income from continuing operations by approximately $0.9 million.
Xcel Energy’s short-term wholesale and commodity trading operations measure the outstanding risk exposure to price
changes on transactions, contracts and obligations that have been entered into, but not closed, using an industry
standard methodology known as Value at Risk (VaR). VaR expresses the potential change in fair value on the
outstanding transactions, contracts and obligations over a particular period of time under normal market conditions.
The VaRs for the NSP-Minnesota and PSCo commodity trading operations, calculated on a consolidated basis, were as
follows:
Year Ended
Dec. 31 VaR Limit Average High Low
(Millions of Dollars)
2009 ................................. $0.50 $5.00 $0.44 $2.02 $0.06
2008 ................................. 0.30 5.00 0.30 1.14 0.01
Interest Rate Risk — Xcel Energy and its subsidiaries are subject to the risk of fluctuating interest rates in the normal
course of business. Xcel Energy’s risk management policy allows interest rate risk to be managed through the use of
fixed rate debt, floating rate debt and interest rate derivatives such as swaps, caps, collars and put or call options.
At Dec. 31, 2009, a 100-basis-point change in the benchmark rate on Xcel Energy’s variable rate debt would impact
pretax interest expense by approximately $5.4 million annually. See Note 13 to the consolidated financial statements for
a discussion of Xcel Energy and its subsidiaries’ interest rate derivatives.
71