Xcel Energy 2009 Annual Report Download - page 167
Download and view the complete annual report
Please find page 167 of the 2009 Xcel Energy annual report below. You can navigate through the pages in the report by either clicking on the pages listed below, or by using the keyword search tool below to find specific information within the annual report.-
 1
1 -
2
-
3
-
4
-
5
-
6
-
7
-
8
-
9
-
10
-
11
-
12
-
13
-
14
-
15
-
16
-
17
-
18
-
19
-
20
-
21
-
22
-
23
-
24
-
25
-
26
-
27
-
28
-
29
-
30
-
31
-
32
-
33
-
34
-
35
-
36
-
37
-
38
-
39
-
40
-
41
-
42
-
43
-
44
-
45
-
46
-
47
-
48
-
49
-
50
-
51
-
52
-
53
-
54
-
55
-
56
-
57
-
58
-
59
-
60
-
61
-
62
-
63
-
64
-
65
-
66
-
67
-
68
-
69
-
70
-
71
-
72
-
73
-
74
-
75
-
76
-
77
-
78
-
79
-
80
-
81
-
82
-
83
-
84
-
85
-
86
-
87
-
88
-
89
-
90
-
91
-
92
-
93
-
94
-
95
-
96
-
97
-
98
-
99
-
100
-
101
-
102
-
103
-
104
-
105
-
106
-
107
-
108
-
109
-
110
-
111
-
112
-
113
-
114
-
115
-
116
-
117
-
118
-
119
-
120
-
121
-
122
-
123
-
124
-
125
-
126
-
127
-
128
-
129
-
130
-
131
-
132
-
133
-
134
-
135
-
136
-
137
-
138
-
139
-
140
-
141
-
142
-
143
-
144
-
145
-
146
-
147
-
148
-
149
-
150
-
151
-
152
-
153
-
154
-
155
-
156
-
 157
157 -
 158
158 -
 159
159 -
 160
160 -
 161
161 -
 162
162 -
 163
163 -
 164
164 -
 165
165 -
 166
166 -
 167
167 -
 168
168 -
 169
169 -
 170
170 -
 171
171 -
 172
172
 |
 |

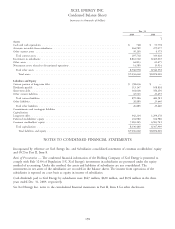
SCHEDULE I
XCEL ENERGY INC.
Condensed Statements of Income
(amounts in thousands of dollars)
Year Ended Dec. 31
2009 2008 2007
Income
Equity earnings of unconsolidated subsidiaries .......................... $743,798 $708,943 $640,140
Total income ............................................. 743,798 708,943 640,140
Expenses and other deductions
Operating expenses ........................................... 9,116 10,481 7,630
Other income .............................................. (1,295) (6,327) (5,556)
Interest charges and financing costs ................................. 101,118 114,341 118,017
Total expenses and other deductions ............................... 108,939 118,495 120,091
Income from continuing operations before income taxes ..................... 634,859 590,448 520,049
Income tax benefit ............................................. (50,665) (55,272) (55,850)
Income from continuing operations .................................. 685,524 645,720 575,899
Income (loss) from discontinued operations, net of tax ...................... (4,637) (166) 1,449
Net income ................................................. 680,887 645,554 577,348
Dividend requirements on preferred stock .............................. 4,241 4,241 4,241
Earnings available to common shareholders ............................. $676,646 $641,313 $573,107
XCEL ENERGY INC.
Condensed Statements of Cash Flows
(amounts in thousands of dollars)
Year Ended Dec. 31
2009 2008 2007
Operating activities
Net cash provided by operating activities ............................. $627,013 $ 455,388 $ 566,688
Investing activities
Return of capital from subsidiaries ................................. — 64,353 129,551
Capital contributions to subsidiaries ................................ (297,004) (630,427) (559,266)
Net cash used in investing activities ................................ (297,004) (566,074) (429,715)
Financing activities
Proceeds from short-term borrowings, net ............................. 13,750 125,000 238,877
Proceeds from issuance of long-term debt ............................. — 386,518 —
Repayment of long-term debt .................................... — (322,803) —
Proceeds from issuance of common stock ............................. 20,133 352,871 10,539
Early participation payment on debt exchange .......................... — — (4,859)
Dividends paid ............................................. (414,922) (382,283) (378,892)
Net cash used in (provided by) financing activities ....................... (381,039) 159,303 (134,335)
Net increase (decrease) in cash and cash equivalents ........................ (51,030) 48,617 2,638
Cash and cash equivalents at beginning of period ......................... 51,778 3,161 523
Cash and cash equivalents at end of period ............................. $ 748 $ 51,778 $ 3,161
157