Xcel Energy 2009 Annual Report Download - page 107
Download and view the complete annual report
Please find page 107 of the 2009 Xcel Energy annual report below. You can navigate through the pages in the report by either clicking on the pages listed below, or by using the keyword search tool below to find specific information within the annual report.-
 1
1 -
2
-
3
-
4
-
5
-
6
-
7
-
8
-
9
-
10
-
11
-
12
-
13
-
14
-
15
-
16
-
17
-
18
-
19
-
20
-
21
-
22
-
23
-
24
-
25
-
26
-
27
-
28
-
29
-
30
-
31
-
32
-
33
-
34
-
35
-
36
-
37
-
38
-
39
-
40
-
41
-
42
-
43
-
44
-
45
-
46
-
47
-
48
-
49
-
50
-
51
-
52
-
53
-
54
-
55
-
56
-
57
-
58
-
59
-
60
-
61
-
62
-
63
-
64
-
65
-
66
-
67
-
68
-
69
-
70
-
71
-
72
-
73
-
74
-
75
-
76
-
77
-
78
-
79
-
80
-
81
-
82
-
83
-
84
-
85
-
86
-
87
-
88
-
89
-
90
-
91
-
92
-
93
-
94
-
95
-
96
-
 97
97 -
 98
98 -
 99
99 -
 100
100 -
 101
101 -
 102
102 -
 103
103 -
 104
104 -
 105
105 -
 106
106 -
 107
107 -
 108
108 -
 109
109 -
 110
110 -
 111
111 -
 112
112 -
 113
113 -
 114
114 -
 115
115 -
 116
116 -
 117
117 -
118
-
119
-
120
-
121
-
122
-
123
-
124
-
125
-
126
-
127
-
128
-
129
-
130
-
131
-
132
-
133
-
134
-
135
-
136
-
137
-
138
-
139
-
140
-
141
-
142
-
143
-
144
-
145
-
146
-
147
-
148
-
149
-
150
-
151
-
152
-
153
-
154
-
155
-
156
-
157
-
158
-
159
-
160
-
161
-
162
-
163
-
164
-
165
-
166
-
167
-
168
-
169
-
170
-
171
-
172
 |
 |

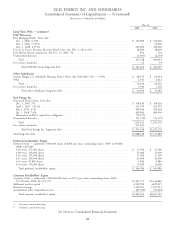
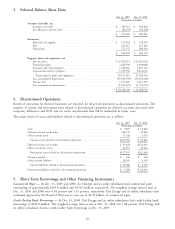
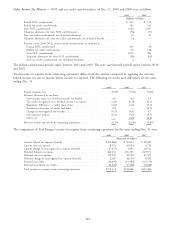
3. Selected Balance Sheet Data
Dec. 31, 2009 Dec. 31, 2008
(Thousands of Dollars)
Accounts receivable, net
Accounts receivable ................................... $ 785,512 $ 965,020
Less allowance for bad debts ............................. (56,103) (64,239)
$ 729,409 $ 900,781
Inventories
Materials and supplies ................................. $ 172,993 $ 158,709
Fuel ............................................ 221,457 227,462
Natural gas ........................................ 171,755 280,538
$ 566,205 $ 666,709
Property, plant and equipment, net
Electric plant ....................................... $22,589,071 $ 21,601,094
Natural gas plant .................................... 3,269,934 3,004,088
Common and other property ............................. 1,492,463 1,497,162
Construction work in progress ............................ 1,769,545 1,832,022
Total property, plant and equipment ....................... 29,121,013 27,934,366
Less accumulated depreciation ............................ (10,914,509) (10,501,266)
Nuclear fuel ....................................... 1,737,469 1,611,193
Less accumulated amortization ............................ (1,435,677) (1,355,573)
$ 18,508,296 $ 17,688,720
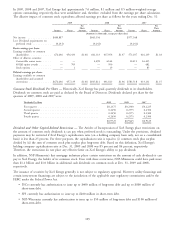
4. Discontinued Operations
Results of operations for divested businesses are reported, for all periods presented, as discontinued operations. The
majority of current and noncurrent assets related to discontinued operations are deferred tax assets associated with
temporary differences and NOL and tax credit carryforwards that will be deductible in future years.
The major classes of assets and liabilities related to discontinued operations are as follows:
Dec. 31, 2009 Dec. 31, 2008
(Thousands of Dollars)
Cash ............................................... $ 7,859 $ 10,645
Deferred income tax benefits ................................ 106,770 39,422
Other current assets ...................................... 37,326 6,574
Current assets related to discontinued operations .................. $151,955 $ 56,641
Deferred income tax benefits ................................ $ 95,424 $150,912
Other noncurrent assets ................................... 21,973 30,544
Noncurrent assets related to discontinued operations ................ $117,397 $181,456
Accounts payable ....................................... $ 445 $ 760
Other current liabilities ................................... 28,635 6,169
Current liabilities related to discontinued operations ................ $ 29,080 $ 6,929
Noncurrent liabilities related to discontinued operations ............... $ 3,389 $ 20,656
5. Short-Term Borrowings and Other Financing Instruments
Commercial Paper — At Dec. 31, 2009 and 2008, Xcel Energy and its utility subsidiaries had commercial paper
outstanding of approximately $459.0 million and $330.3 million, respectively. The weighted average interest rates at
Dec. 31, 2009 and 2008 were 0.36 percent and 3.53 percent, respectively. Xcel Energy and its utility subsidiaries have
combined approval by the Board of Directors to issue up to $2.25 billion of commercial paper.
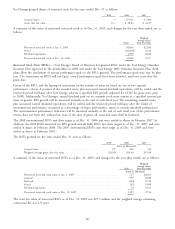
Credit Facility Bank Borrowings — At Dec. 31, 2008, Xcel Energy and its utility subsidiaries had credit facility bank
borrowings of $125.0 million. The weighted average interest rate at Dec. 31, 2008 was 1.88 percent. Xcel Energy and
its utility subsidiaries had no credit facility bank borrowings at Dec. 31, 2009.
97