Xcel Energy 2009 Annual Report Download - page 70
Download and view the complete annual report
Please find page 70 of the 2009 Xcel Energy annual report below. You can navigate through the pages in the report by either clicking on the pages listed below, or by using the keyword search tool below to find specific information within the annual report.-
 1
1 -
2
-
3
-
4
-
5
-
6
-
7
-
8
-
9
-
10
-
11
-
12
-
13
-
14
-
15
-
16
-
17
-
18
-
19
-
20
-
21
-
22
-
23
-
24
-
25
-
26
-
27
-
28
-
29
-
30
-
31
-
32
-
33
-
34
-
35
-
36
-
37
-
38
-
39
-
40
-
41
-
42
-
43
-
44
-
45
-
46
-
47
-
48
-
49
-
50
-
51
-
52
-
53
-
54
-
55
-
56
-
57
-
58
-
59
-
 60
60 -
 61
61 -
 62
62 -
 63
63 -
 64
64 -
 65
65 -
 66
66 -
 67
67 -
 68
68 -
 69
69 -
 70
70 -
 71
71 -
 72
72 -
 73
73 -
 74
74 -
 75
75 -
 76
76 -
 77
77 -
 78
78 -
 79
79 -
 80
80 -
81
-
82
-
83
-
84
-
85
-
86
-
87
-
88
-
89
-
90
-
91
-
92
-
93
-
94
-
95
-
96
-
97
-
98
-
99
-
100
-
101
-
102
-
103
-
104
-
105
-
106
-
107
-
108
-
109
-
110
-
111
-
112
-
113
-
114
-
115
-
116
-
117
-
118
-
119
-
120
-
121
-
122
-
123
-
124
-
125
-
126
-
127
-
128
-
129
-
130
-
131
-
132
-
133
-
134
-
135
-
136
-
137
-
138
-
139
-
140
-
141
-
142
-
143
-
144
-
145
-
146
-
147
-
148
-
149
-
150
-
151
-
152
-
153
-
154
-
155
-
156
-
157
-
158
-
159
-
160
-
161
-
162
-
163
-
164
-
165
-
166
-
167
-
168
-
169
-
170
-
171
-
172
 |
 |

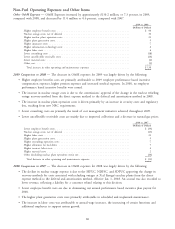
Non-Fuel Operating Expenses and Other Items
Other O&M Expenses — O&M Expenses increased by approximately $130.2 million, or 7.3 percent, in 2009,
compared with 2008, and decreased by 11.0 million or 0.6 percent, compared with 2007.
2009 vs. 2008
(Millions of Dollars)
Higher employee benefit costs ........................................... $ 90
Nuclear outage costs, net of deferral ....................................... 30
Higher nuclear plant operation costs ....................................... 21
Higher plant generation costs ............................................ 9
Higher insurance costs ................................................ 7
Higher information technology costs ....................................... 6
Higher labor costs ................................................... 6
Lower consulting costs ................................................ (18)
Lower uncollectible receivable costs ........................................ (14)
Lower material costs ................................................. (4)
Other, net ........................................................ (3)
Total increase in other operating and maintenance expenses ....................... $130
2009 Comparison to 2008 — The decrease in O&M expenses for 2009 was largely driven by the following:
• Higher employee benefits costs are primarily attributable to 2009 employee performance based incentive
compensation expenses, higher pension expenses and increased medical expenses. In 2008, no employee
performance based incentive benefits were earned.
• The increase in nuclear outage costs is due to the commissions’ approval of the change in the nuclear refueling
outage recovery method from the direct expense method to the deferral and amortization method in 2008.
• The increase in nuclear plant operation costs is driven primarily by an increase in security costs and regulatory
fees, resulting from new NRC requirements.
• Lower consulting costs are primarily the result of cost management initiatives achieved throughout 2009.
• Lower uncollectible receivable costs are mainly due to improved collections and a decrease in natural gas prices.
2008 vs. 2007
(Millions of Dollars)
Lower employee benefit costs ............................................ $ (39)
Nuclear outage costs, net of deferral ....................................... (13)
Higher labor costs ................................................... 22
Higher plant generation costs ............................................ 9
Higher consulting operation costs ......................................... 7
Higher allowance for bad debts .......................................... 7
Higher contract labor costs ............................................. 4
Higher material costs ................................................. 2
Other (including nuclear plant operation costs), net .............................. (10)
Total decrease in other operating and maintenance expenses ....................... $(11)
2008 Comparison to 2007 — The decrease in O&M expenses for 2008 was largely driven by the following:
• The decline in nuclear outage expense is due to the MPUC, NDPSC, and SDPUC approving the change in
recovery methods for costs associated with refueling outages at Xcel Energy’s nuclear plants from the direct
expense method to the deferral and amortization method, effective Jan. 1, 2008. An accrual was also recorded to
lower revenue, reflecting a liability for a customer refund relating to this decision.
• Lower employee benefit costs are due to eliminating our annual performance based incentive plan payout for
2008.
• The higher plant generation costs were primarily attributable to scheduled and unplanned maintenance.
• The increase in labor costs was attributable to annual wage increases, the insourcing of certain functions and
additional employees to support system growth.
60