Xcel Energy 2009 Annual Report Download - page 87
Download and view the complete annual report
Please find page 87 of the 2009 Xcel Energy annual report below. You can navigate through the pages in the report by either clicking on the pages listed below, or by using the keyword search tool below to find specific information within the annual report.-
 1
1 -
2
-
3
-
4
-
5
-
6
-
7
-
8
-
9
-
10
-
11
-
12
-
13
-
14
-
15
-
16
-
17
-
18
-
19
-
20
-
21
-
22
-
23
-
24
-
25
-
26
-
27
-
28
-
29
-
30
-
31
-
32
-
33
-
34
-
35
-
36
-
37
-
38
-
39
-
40
-
41
-
42
-
43
-
44
-
45
-
46
-
47
-
48
-
49
-
50
-
51
-
52
-
53
-
54
-
55
-
56
-
57
-
58
-
59
-
60
-
61
-
62
-
63
-
64
-
65
-
66
-
67
-
68
-
69
-
70
-
71
-
72
-
73
-
74
-
75
-
76
-
 77
77 -
 78
78 -
 79
79 -
 80
80 -
 81
81 -
 82
82 -
 83
83 -
 84
84 -
 85
85 -
 86
86 -
 87
87 -
 88
88 -
 89
89 -
 90
90 -
 91
91 -
 92
92 -
 93
93 -
 94
94 -
 95
95 -
 96
96 -
 97
97 -
98
-
99
-
100
-
101
-
102
-
103
-
104
-
105
-
106
-
107
-
108
-
109
-
110
-
111
-
112
-
113
-
114
-
115
-
116
-
117
-
118
-
119
-
120
-
121
-
122
-
123
-
124
-
125
-
126
-
127
-
128
-
129
-
130
-
131
-
132
-
133
-
134
-
135
-
136
-
137
-
138
-
139
-
140
-
141
-
142
-
143
-
144
-
145
-
146
-
147
-
148
-
149
-
150
-
151
-
152
-
153
-
154
-
155
-
156
-
157
-
158
-
159
-
160
-
161
-
162
-
163
-
164
-
165
-
166
-
167
-
168
-
169
-
170
-
171
-
172
 |
 |

Commercial Paper — Xcel Energy, NSP-Minnesota, PSCo and SPS each have individual commercial paper programs.
The authorized levels for these commercial paper programs are:
• $800 million for Xcel Energy;
• $500 million for NSP-Minnesota;
• $700 million for PSCo; and
• $250 million for SPS.
Credit Facilities — As of Feb. 12, 2010 Xcel Energy and its utility subsidiaries had the following committed credit
facilities available to meet its liquidity needs:
Facility Drawn(a) Available Cash Liquidity Facility
(Millions of Dollars)
NSP-Minnesota .............. $ 482.22 $ 30.80 $ 451.42 $36.16 $ 487.58 December 2011
PSCo ..................... 675.11 74.65 600.46 2.76 603.22 December 2011
SPS...................... 247.86 10.00 237.86 44.53 282.39 December 2011
Xcel Energy — Holding Company . . 771.56 369.60 401.96 0.42 402.38 December 2011
NSP-Wisconsin(b) ............. — — 0.24 0.24
Total ................... $2,176.75 $485.05 $1,691.70 $84.11 $1,775.81
(a) Includes direct borrowings, outstanding commercial paper and letters of credit.
(b) NSP-Wisconsin does not have a specific credit facility; however, it has a borrowing agreement with NSP-Minnesota.
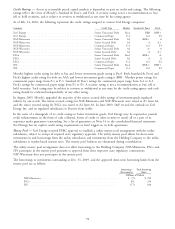
Listed below is a summary of the banks that make up the credit facilities of Xcel Energy and its subsidiaries as of
Feb. 12, 2010.
Xcel Energy
Holding Co. PSCo SPS NSP-Minnesota Total
(Millions of Dollars)
Bank of America .......................... $71.11 $ 62.22 $ 22.23 $ 44.44 $ 200.00
Barclays ............................... 54.22 47.45 16.94 33.89 152.50
JP Morgan ............................. 54.22 47.45 16.94 33.89 152.50
Wells Fargo ............................. 62.67 37.33 13.33 26.67 140.00
Bank of New York-Mellon .................... 42.67 37.33 13.33 26.67 120.00
Bank of Tokyo/Mitsubishi .................... 42.67 37.33 13.33 26.67 120.00
BMO Capital Markets ...................... 42.67 37.33 13.33 26.67 120.00
BNP Paribas ............................ 42.67 37.33 13.33 26.67 120.00
KeyBank National Association ................. 42.67 37.33 13.33 26.67 120.00
Morgan Stanley Bank ....................... 42.67 37.33 13.33 26.67 120.00
Royal Bank of Scotland ..................... 42.67 37.33 13.33 26.67 120.00
Bank of Nova Scotia ....................... 42.67 37.33 13.33 26.67 120.00
UBS ................................. 42.67 37.33 13.33 26.67 120.00
Citibank ............................... 22.67 37.33 13.33 26.67 100.00
Credit Suisse ............................ 28.44 24.89 8.90 17.77 80.00
Goldman Sachs ........................... 28.44 24.89 8.90 17.77 80.00
Mizuho Corporate Bank ..................... 28.44 24.89 8.90 17.77 80.00
US Bank............................... 28.44 24.89 8.90 17.77 80.00
Amarillo National Bank ..................... 8.88 7.80 2.77 5.55 25.00
Sumitomo .............................. — — 6.75 — 6.75
Total ............................... $771.56 $675.11 $247.86 $482.22 $2,176.75
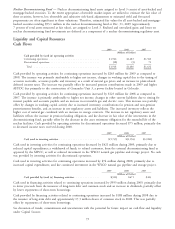
Operating cash flow as a source of short-term funding is affected by such operating factors as weather, regulatory
requirements, including rate recovery of costs, environmental regulation compliance, changes in the trends for energy
prices, supply and operational uncertainties and other changes in working capital, all of which are difficult to predict.
See further discussion of such factors under Statement of Operations Analysis.
Short-term borrowing as a source of funding is affected by regulatory actions, credit ratings and access to reasonably
priced capital markets. For additional information on Xcel Energy’s short-term borrowing arrangements, see Note 5 to
the consolidated financial statements.
77