Xcel Energy 2009 Annual Report Download - page 120
Download and view the complete annual report
Please find page 120 of the 2009 Xcel Energy annual report below. You can navigate through the pages in the report by either clicking on the pages listed below, or by using the keyword search tool below to find specific information within the annual report.-
 1
1 -
2
-
3
-
4
-
5
-
6
-
7
-
8
-
9
-
10
-
11
-
12
-
13
-
14
-
15
-
16
-
17
-
18
-
19
-
20
-
21
-
22
-
23
-
24
-
25
-
26
-
27
-
28
-
29
-
30
-
31
-
32
-
33
-
34
-
35
-
36
-
37
-
38
-
39
-
40
-
41
-
42
-
43
-
44
-
45
-
46
-
47
-
48
-
49
-
50
-
51
-
52
-
53
-
54
-
55
-
56
-
57
-
58
-
59
-
60
-
61
-
62
-
63
-
64
-
65
-
66
-
67
-
68
-
69
-
70
-
71
-
72
-
73
-
74
-
75
-
76
-
77
-
78
-
79
-
80
-
81
-
82
-
83
-
84
-
85
-
86
-
87
-
88
-
89
-
90
-
91
-
92
-
93
-
94
-
95
-
96
-
97
-
98
-
99
-
100
-
101
-
102
-
103
-
104
-
105
-
106
-
107
-
108
-
109
-
 110
110 -
 111
111 -
 112
112 -
 113
113 -
 114
114 -
 115
115 -
 116
116 -
 117
117 -
 118
118 -
 119
119 -
 120
120 -
 121
121 -
 122
122 -
 123
123 -
 124
124 -
 125
125 -
 126
126 -
 127
127 -
 128
128 -
 129
129 -
 130
130 -
131
-
132
-
133
-
134
-
135
-
136
-
137
-
138
-
139
-
140
-
141
-
142
-
143
-
144
-
145
-
146
-
147
-
148
-
149
-
150
-
151
-
152
-
153
-
154
-
155
-
156
-
157
-
158
-
159
-
160
-
161
-
162
-
163
-
164
-
165
-
166
-
167
-
168
-
169
-
170
-
171
-
172
 |
 |

ASC 820 Fair Value Measurements establishes a hierarchal framework for disclosing the observability of the inputs
utilized in measuring fair value. The three levels defined by the hierarchy and examples of each level are as follows:
Level 1 — Quoted prices are available in active markets for identical assets as of the reporting date. The types of
assets included in Level 1 are highly liquid and actively traded instruments with quoted prices, such as common
stocks listed by the New York Stock Exchange.
Level 2 — Pricing inputs are other than quoted prices in active markets, but are either directly or indirectly
observable as of the reporting date. The types of assets included in Level 2 are typically either comparable to
actively traded securities or contracts or priced with models using highly observable inputs, such as corporate bonds
with pricing based on market interest rate curves and recent trades of similarly rated securities.
Level 3 — Significant inputs to pricing have little or no observability as of the reporting date. The types of assets
included in Level 3 are those with inputs requiring significant management judgment or estimation, such as asset
and mortgage backed securities, for which subjective risk-based adjustments to estimated yield and forecasted
prepayments are significant inputs.
Pension Benefits
Xcel Energy has several noncontributory, defined benefit pension plans that cover almost all employees. Benefits are
based on a combination of years of service, the employee’s average pay and social security benefits. Xcel Energy’s policy
is to fully fund the actuarially determined pension costs recognized for ratemaking and financial reporting purposes,
subject to the limitations of applicable employee benefit and tax laws, into an external trust over time.
Xcel Energy bases its investment-return assumption on expected long-term performance for each of the investment types
included in its pension asset portfolio. Xcel Energy considers the actual historical returns achieved by its asset portfolio
over the past 20-year or longer period, as well as the long-term return levels projected and recommended by investment
experts. The historical weighted average annual return for the past 20 years for the Xcel Energy portfolio of pension
investments is 8.98 percent, which is greater than the current assumption level. The pension cost determination assumes
a forecasted mix of investment types over the long term. Investment returns in 2009 were above the assumed level of
8.50 percent while returns in 2008 and 2007 were below the assumed level of 8.75 percent. Xcel Energy continually
reviews its pension assumptions. In 2010, Xcel Energy will use an investment-return assumption of 7.79 percent.
The assets are invested in a portfolio according to Xcel Energy’s return, liquidity and diversification objectives to
provide a source of funding for plan obligations and minimize the necessity of contributions to the plan, within
appropriate levels of risk. The principal mechanism for achieving these objectives is the allocation of assets to selected
asset classes, given the long-term risk, return, and liquidity characteristics of each particular asset class. There were no
significant concentrations of risk in any particular industry, index, or entity, however, a higher weighting in equity
investments can increase the volatility in the return levels achieved by pension assets in any year.
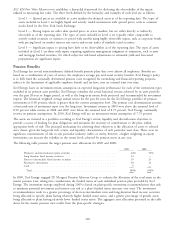
The following table presents the target pension asset allocations for 2009 and 2008:
2009 2008
Domestic and international equity securities ........................... 24% 52%
Long duration fixed income securities ............................... 34 —
Short to intermediate fixed income securities .......................... 19 25
Alternative investments ........................................ 18 23
Cash ................................................... 5 —
Total ................................................. 100% 100%
In 2009, Xcel Energy engaged J.P. Morgan’s Pension Advisory Group to evaluate the allocation of the total assets in the
master pension trust, taking into consideration the funded status of each individual pension plan provided by Xcel
Energy. The investment strategy employed during 2009 is based on plan-specific investment recommendations that seek
to minimize potential investment and interest rate risk as a plan’s funded status increases over time. The investment
recommendations result in a greater percentage of short-to-intermediate term and long-duration fixed income securities
being allocated to specific plans having relatively higher funded status ratios, and a greater percentage of growth assets
being allocated to plans having relatively lower funded status ratios. The aggregate asset allocation presented in the table
above for the master pension trust results from the plan-specific strategies.
110