U-Haul 2011 Annual Report Download - page 97
Download and view the complete annual report
Please find page 97 of the 2011 U-Haul annual report below. You can navigate through the pages in the report by either clicking on the pages listed below, or by using the keyword search tool below to find specific information within the annual report.-
 1
1 -
2
-
3
-
4
-
5
-
6
-
7
-
8
-
9
-
10
-
11
-
12
-
13
-
14
-
15
-
16
-
17
-
18
-
19
-
20
-
21
-
22
-
23
-
24
-
25
-
26
-
27
-
28
-
29
-
30
-
31
-
32
-
33
-
34
-
35
-
36
-
37
-
38
-
39
-
40
-
41
-
42
-
43
-
44
-
45
-
46
-
47
-
48
-
49
-
50
-
51
-
52
-
53
-
54
-
55
-
56
-
57
-
58
-
59
-
60
-
61
-
62
-
63
-
64
-
65
-
66
-
67
-
68
-
69
-
70
-
71
-
72
-
73
-
74
-
75
-
76
-
77
-
78
-
79
-
80
-
81
-
82
-
83
-
84
-
85
-
86
-
 87
87 -
 88
88 -
 89
89 -
 90
90 -
 91
91 -
 92
92 -
 93
93 -
 94
94 -
 95
95 -
 96
96 -
 97
97 -
 98
98 -
 99
99 -
 100
100 -
 101
101 -
 102
102 -
 103
103 -
 104
104 -
 105
105 -
 106
106 -
 107
107 -
108
-
109
-
110
-
111
-
112
-
113
-
114
-
115
-
116
-
117
-
118
-
119
-
120
-
121
-
122
-
123
-
124
-
125
-
126
 |
 |

AMERCO AND CONSOLIDATED SUBSIDIARIES
NOTES TO CONSOLIDATED FINANCIAL STATEMENTS -- (CONTINUED)
F-41
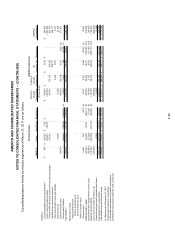
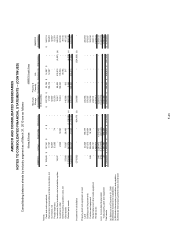
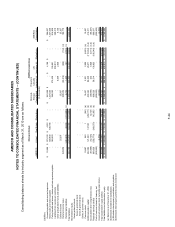
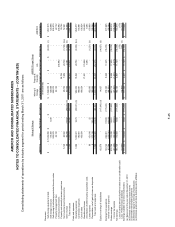
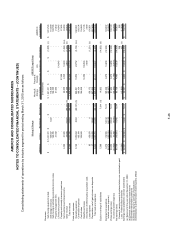
Note 22A: Financial Information by Consolidating Industry Segment:
Consolidating balance sheets by industry segment as of March 31, 2011 are as follows:
AMERCO U-Haul Real Estate Eliminations
Moving &
Storage
Consolidated
Property &
Casualty
Insurance (a)
Life
Insurance (a) Eliminations
AMERCO
Consolidated
Assets:
Cash and cash equivalents 250,104$ 72,634$ 757$ -$ 323,495$ 14,700$ 37,301$ -$ 375,496$
Reinsurance recoverables and trade receivables, net - 19,210 - - 19,210 173,256 12,905 - 205,371
Inventories, net - 59,942 - - 59,942 - - - 59,942
Prepaid expenses 15,966 41,533 125 - 57,624 - - - 57,624
Investments, fixed maturities and marketable equities 22,946 - - - 22,946 126,240 518,620 (7,997) (d) 659,809
Investments, other - 10,385 18,605 - 28,990 90,615 82,263 - 201,868
Deferred policy acquisition costs, net - - - - - - 52,870 - 52,870
Other assets 2,863 134,330 28,251 - 165,444 877 312 - 166,633
Related party assets 1,146,296 247,024 72 (1,089,457) (c) 303,935 2,801 - (4,768) (c) 301,968
1,438,175 585,058 47,810 (1,089,457) 981,586 408,489 704,271 (12,765) 2,081,581
Investment in subsidiaries (138,714) - - 482,025 (b) 343,311 - - (343,311) (b) -
Property, plant and equipment, at cost:
Land - 46,651 192,526 - 239,177 - - - 239,177
Buildings and improvements - 150,585 874,084 - 1,024,669 - - - 1,024,669
Furniture and equipment 203 292,242 18,226 - 310,671 - - - 310,671
Rental trailers and other rental equipment - 249,700 - - 249,700 - - - 249,700
Rental trucks - 1,611,763 - - 1,611,763 - - - 1,611,763
203 2,350,941 1,084,836 - 3,435,980 - - - 3,435,980
Less: Accumulated depreciation (176) (996,192) (345,039) - (1,341,407) - - - (1,341,407)
Total property, plant and equipment 27 1,354,749 739,797 - 2,094,573 - - - 2,094,573
Total assets 1,299,488$ 1,939,807$ 787,607$ (607,432)$ 3,419,470$ 408,489$ 704,271$ (356,076)$ 4,176,154$
(a) Balances as of December 31, 2010
(b) Eliminate investment in subsidiaries
(c) Eliminate intercompany receivables and payables
(d) Eliminate intercompany preferred stock investment
Moving & Storage AMERCO Legal Group
(In thousands)