U-Haul 2011 Annual Report Download - page 84
Download and view the complete annual report
Please find page 84 of the 2011 U-Haul annual report below. You can navigate through the pages in the report by either clicking on the pages listed below, or by using the keyword search tool below to find specific information within the annual report.-
 1
1 -
2
-
3
-
4
-
5
-
6
-
7
-
8
-
9
-
10
-
11
-
12
-
13
-
14
-
15
-
16
-
17
-
18
-
19
-
20
-
21
-
22
-
23
-
24
-
25
-
26
-
27
-
28
-
29
-
30
-
31
-
32
-
33
-
34
-
35
-
36
-
37
-
38
-
39
-
40
-
41
-
42
-
43
-
44
-
45
-
46
-
47
-
48
-
49
-
50
-
51
-
52
-
53
-
54
-
55
-
56
-
57
-
58
-
59
-
60
-
61
-
62
-
63
-
64
-
65
-
66
-
67
-
68
-
69
-
70
-
71
-
72
-
73
-
 74
74 -
 75
75 -
 76
76 -
 77
77 -
 78
78 -
 79
79 -
 80
80 -
 81
81 -
 82
82 -
 83
83 -
 84
84 -
 85
85 -
 86
86 -
 87
87 -
 88
88 -
 89
89 -
 90
90 -
 91
91 -
 92
92 -
 93
93 -
 94
94 -
95
-
96
-
97
-
98
-
99
-
100
-
101
-
102
-
103
-
104
-
105
-
106
-
107
-
108
-
109
-
110
-
111
-
112
-
113
-
114
-
115
-
116
-
117
-
118
-
119
-
120
-
121
-
122
-
123
-
124
-
125
-
126
 |
 |

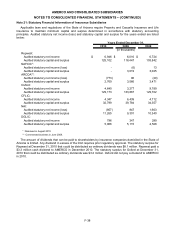
AMERCO AND CONSOLIDATED SUBSIDIARIES
NOTES TO CONSOLIDATED FINANCIAL STATEMENTS -- (CONTINUED)
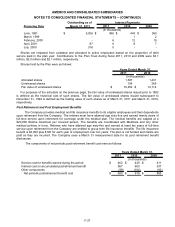
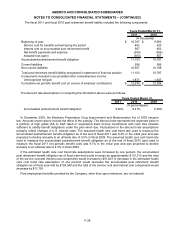
The fiscal 2011 and fiscal 2010 post retirement benefit liability included the following components:
2011 2010
$ 10,787 $ 9,563
462 420
567 603
(350) (356)
(363) 557
11,103 10,787
Current liabilities 596 589
10,507 10,198
11,103 10,787
1,871 1,547
$ 12,974 $ 12,334
Components included in accumulated other comprehensive income:
Unrecognized net gain
Cumulative net periodic benefit cost (in excess of employer contribution)
Beginning of year
Actuarial loss (gain)
Accumulated postretirement benefit obligation
Non-current liabilities
Total post retirement benefit liability recognized in statement of financial position
Years Ended March 31,
(In thousands)
Service cost for benefits earned during the period
Interest cost on accumulated post retirement benefit
Net benefit payments and expense
The discount rate assumptions in computing the information above were as follows:
2011 2010 2009
Accumulated postretirement benefit obligation 5.00% 5.41% 6.50%
Years Ended March 31,
(In percentages)
In December 2003, the Medicare Prescription Drug Improvement and Modernization Act of 2003 became
law. Amounts shown above include the effect of the subsidy. The discount rate represents the expected yield on
a portfolio of high grade (AA to AAA rated or equivalent) fixed income investments with cash flow streams
sufficient to satisfy benefit obligations under the plan when due. Fluctuations in the discount rate assumptions
primarily reflect changes in U.S. interest rates. The assumed health care cost trend rate used to measure the
accumulated postretirement benefit obligation as of the end of fiscal 2011 was 8.4% in the initial year and was
projected to decline annually to an ultimate rate of 4.5% in fiscal 2029. The assumed health care cost trend rate
used to measure the accumulated postretirement benefit obligation as of the end of fiscal 2010 (and used to
measure the fiscal 2011 net periodic benefit cost) was 8.7% in the initial year and was projected to decline
annually to an ultimate rate of 4.5% in fiscal 2029.
If the estimated health care cost trend rate assumptions were increased by one percent, the accumulated
post retirement benefit obligation as of fiscal year-end would increase by approximately $112,212 and the total
of the service cost and interest cost components would increase by $10,433. A decrease in the estimated health
care cost trend rate assumption of one percent would decrease the accumulated post retirement benefit
obligation as of fiscal year-end by $124,040 and the total of the service cost and interest cost components would
decrease by $11,791.
Post employment benefits provided by the Company, other than upon retirement, are not material.
F-28