U-Haul 2011 Annual Report Download - page 36
Download and view the complete annual report
Please find page 36 of the 2011 U-Haul annual report below. You can navigate through the pages in the report by either clicking on the pages listed below, or by using the keyword search tool below to find specific information within the annual report.-
 1
1 -
2
-
3
-
4
-
5
-
6
-
7
-
8
-
9
-
10
-
11
-
12
-
13
-
14
-
15
-
16
-
17
-
18
-
19
-
20
-
21
-
22
-
23
-
24
-
25
-
 26
26 -
 27
27 -
 28
28 -
 29
29 -
 30
30 -
 31
31 -
 32
32 -
 33
33 -
 34
34 -
 35
35 -
 36
36 -
 37
37 -
 38
38 -
 39
39 -
 40
40 -
 41
41 -
 42
42 -
 43
43 -
 44
44 -
 45
45 -
 46
46 -
47
-
48
-
49
-
50
-
51
-
52
-
53
-
54
-
55
-
56
-
57
-
58
-
59
-
60
-
61
-
62
-
63
-
64
-
65
-
66
-
67
-
68
-
69
-
70
-
71
-
72
-
73
-
74
-
75
-
76
-
77
-
78
-
79
-
80
-
81
-
82
-
83
-
84
-
85
-
86
-
87
-
88
-
89
-
90
-
91
-
92
-
93
-
94
-
95
-
96
-
97
-
98
-
99
-
100
-
101
-
102
-
103
-
104
-
105
-
106
-
107
-
108
-
109
-
110
-
111
-
112
-
113
-
114
-
115
-
116
-
117
-
118
-
119
-
120
-
121
-
122
-
123
-
124
-
125
-
126
 |
 |

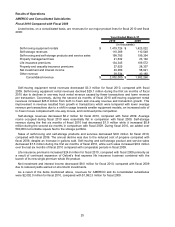
As a result of the above mentioned changes in revenues and expenses, pretax earnings from
operations were $16.9 million and $17.7 million for the years ended December 31, 2009 and 2008,
respectively.
Liquidity and Capital Resources
We believe our current capital structure is a positive factor that will enable us to pursue our operational
plans and goals and provide us with sufficient liquidity for the foreseeable future. The majority of our
obligations currently in place mature at the end of fiscal years 2014, 2015 or 2018. However, since there
are many factors which could affect our liquidity, including some which are beyond our control, there is no
assurance that future cash flows and liquidity resources will be sufficient to meet our outstanding debt
obligations and our other future capital needs.
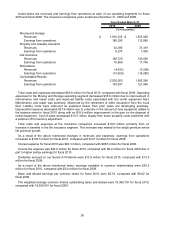
At March 31, 2011, cash and cash equivalents totaled $375.5 million, compared with $244.1 million on
March 31, 2010. The assets of our insurance subsidiaries are generally unavailable to fulfill the
obligations of non-insurance operations (AMERCO, U-Haul and Real Estate). As of March 31, 2011 (or as
otherwise indicated), cash and cash equivalents, other financial assets (receivables, short-term
investments, other investments, fixed maturities, and related party assets) and obligations of each
operating segment were:
Moving & Storage
Property and
Casualty
Insurance (a)
Life
Insurance (a)
Cash and cash equivalents $ 323,495 $ 14,700 $ 37,301
Other financial assets 375,081 392,912 613,788
Debt obligations 1,397,842 - -
(a) As of December 31, 2010
(In thousands)
Our Moving and Storage segment had cash available under existing credit facilities of $232.6 million as
well as $40.6 million of a securitized fleet loan to be used for new equipment purchases.
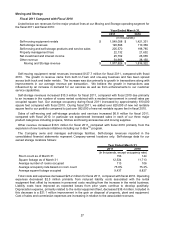
A summary of our consolidated cash flows for fiscal 2011, 2010 and 2009 is shown in the table below:
2011 2010 2009
Net cash provided by operating activities $ 572,794 $ 401,348 $ 274,426
Net cash used by investing activities (380,988) (117,978) (221,192)
Net cash used by financing activities (60,699) (282,483) (17,832)
Effects of exchange rate on cash 271 2,644 (1,437)
Net cash flow 131,378 3,531 33,965
Cash at the beginning of the period 244,118 240,587 206,622
Cash at the end of the period $ 375,496 $ 244,118 $ 240,587
Years Ended March 31,
(In thousands)
Net cash provided by operating activities increased $171.4 million in fiscal 2011, compared with fiscal
2010 primarily due to improved profitability at the Moving and Storage segment. This improvement largely
came from reduced operating costs combined with an $8.8 million reduction in claim payments related to
our U-Haul self-insurance program. Operating cash flows from the Life Insurance segment increased
$67.1 million primarily due to two reinsurance arrangements entered into during fiscal 2011 combined
with new premiums.
Net cash used in investing activities increased $263.0 million in fiscal 2011, compared with fiscal 2010.
Purchases of property, plant and equipment, which are reported net of cash from leases, increased
$220.9 million. Cash from new leases decreased $30.5 million and cash used to purchase new
equipment and invest in construction and real estate increased $187.1 million. Cash from the sales of
31