U-Haul 2011 Annual Report Download - page 78
Download and view the complete annual report
Please find page 78 of the 2011 U-Haul annual report below. You can navigate through the pages in the report by either clicking on the pages listed below, or by using the keyword search tool below to find specific information within the annual report.-
 1
1 -
2
-
3
-
4
-
5
-
6
-
7
-
8
-
9
-
10
-
11
-
12
-
13
-
14
-
15
-
16
-
17
-
18
-
19
-
20
-
21
-
22
-
23
-
24
-
25
-
26
-
27
-
28
-
29
-
30
-
31
-
32
-
33
-
34
-
35
-
36
-
37
-
38
-
39
-
40
-
41
-
42
-
43
-
44
-
45
-
46
-
47
-
48
-
49
-
50
-
51
-
52
-
53
-
54
-
55
-
56
-
57
-
58
-
59
-
60
-
61
-
62
-
63
-
64
-
65
-
66
-
67
-
 68
68 -
 69
69 -
 70
70 -
 71
71 -
 72
72 -
 73
73 -
 74
74 -
 75
75 -
 76
76 -
 77
77 -
 78
78 -
 79
79 -
 80
80 -
 81
81 -
 82
82 -
 83
83 -
 84
84 -
 85
85 -
 86
86 -
 87
87 -
 88
88 -
89
-
90
-
91
-
92
-
93
-
94
-
95
-
96
-
97
-
98
-
99
-
100
-
101
-
102
-
103
-
104
-
105
-
106
-
107
-
108
-
109
-
110
-
111
-
112
-
113
-
114
-
115
-
116
-
117
-
118
-
119
-
120
-
121
-
122
-
123
-
124
-
125
-
126
 |
 |

AMERCO AND CONSOLIDATED SUBSIDIARIES
NOTES TO CONSOLIDATED FINANCIAL STATEMENTS -- (CONTINUED)
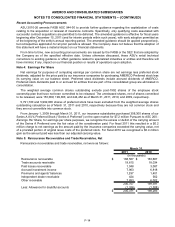
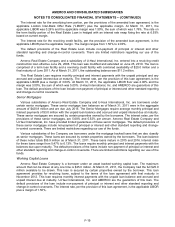
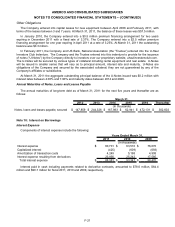
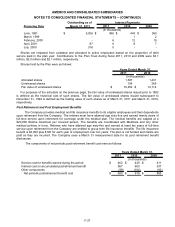
Interest Rates
Interest rates and Company borrowings were as follows:
2011 2010 2009
Weighted average interest rate during the year 1.75% 1.79% 3.67%
Interest rate at year end - 1.74% 2.29%
Maximum amount outstanding during the year
$
111,000
$
207,280
$
212,280
A
verage amount outstanding during the year $ 36,942 $ 184,036 $ 177,520
Facility fees $ 227 $ 906 $ 622
(In thousands, except interest rates)
Revolving Credit Activity
Years Ended March 31,
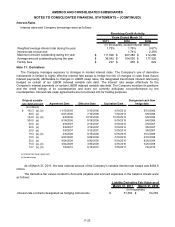
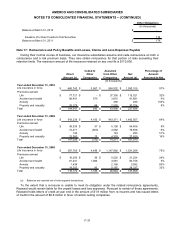
Note 11: Derivatives
The Company manages exposure to changes in market interest rates. The Company’s use of derivative
instruments is limited to highly effective interest rate swaps to hedge the risk of changes in cash flows (future
interest payments) attributable to changes in LIBOR swap rates, the designated benchmark interest rate being
hedged on certain of our LIBOR indexed variable rate debt. The interest rate swaps effectively fix the
Company’s interest payments on certain LIBOR indexed variable rate debt. The Company monitors its positions
and the credit ratings of its counterparties and does not currently anticipate non-performance by the
counterparties. Interest rate swap agreements are not entered into for trading purposes.
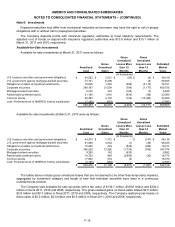
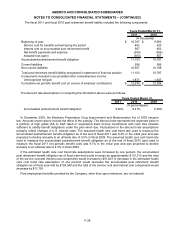
Agreement Date Effective Date Expiration Date
Designated cash flow
hedge date
142.3$ (a), (b) 11/15/2005 5/10/2006 4/10/2012 5/31/2006
50.0 (a) 6/21/2006 7/10/2006 7/10/2013 6/9/2006
144.9 (a), (b) 6/9/2006 10/10/2006 10/10/2012 6/9/2006
300.0 (a) 8/16/2006 8/18/2006 8/10/2018 8/4/2006
30.0 (a) 2/9/2007 2/12/2007 2/10/2014 2/9/2007
20.0 (a) 3/8/2007 3/12/2007 3/10/2014 3/8/2007
20.0 (a) 3/8/2007 3/12/2007 3/10/2014 3/8/2007
19.3 (a), (b) 4/8/2008 8/15/2008 6/15/2015 3/31/2008
19.0 (a) 8/27/2008 8/29/2008 7/10/2015 4/10/2008
30.0 (a) 9/24/2008 9/30/2008 9/10/2015 9/24/2008
15.0 (a), (b) 3/24/2009 3/30/2009 4/15/2016 3/25/2009
14.7 (a), (b) 7/6/2010 8/15/2010 7/15/2017 7/6/2010
(a) interest rate swap agreement
(b) forward swap
Original variable
rate debt amount
(In millions)
As of March 31, 2011, the total notional amount of the Company’s variable interest rate swaps was $484.6
million.
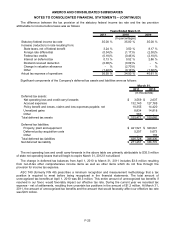
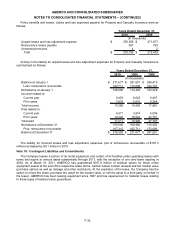
The derivative fair values located in Accounts payable and accrued expenses in the balance sheets were
as follows:
March 31, 2011 March 31, 2010
Interest rate contracts designated as hedging instruments $ 51,052 $ 54,239
Liability Derivative Fair Value as of
(In thousands)
F-22