U-Haul 2011 Annual Report Download - page 32
Download and view the complete annual report
Please find page 32 of the 2011 U-Haul annual report below. You can navigate through the pages in the report by either clicking on the pages listed below, or by using the keyword search tool below to find specific information within the annual report.-
 1
1 -
2
-
3
-
4
-
5
-
6
-
7
-
8
-
9
-
10
-
11
-
12
-
13
-
14
-
15
-
16
-
17
-
18
-
19
-
20
-
21
-
 22
22 -
 23
23 -
 24
24 -
 25
25 -
 26
26 -
 27
27 -
 28
28 -
 29
29 -
 30
30 -
 31
31 -
 32
32 -
 33
33 -
 34
34 -
 35
35 -
 36
36 -
 37
37 -
 38
38 -
 39
39 -
 40
40 -
 41
41 -
 42
42 -
43
-
44
-
45
-
46
-
47
-
48
-
49
-
50
-
51
-
52
-
53
-
54
-
55
-
56
-
57
-
58
-
59
-
60
-
61
-
62
-
63
-
64
-
65
-
66
-
67
-
68
-
69
-
70
-
71
-
72
-
73
-
74
-
75
-
76
-
77
-
78
-
79
-
80
-
81
-
82
-
83
-
84
-
85
-
86
-
87
-
88
-
89
-
90
-
91
-
92
-
93
-
94
-
95
-
96
-
97
-
98
-
99
-
100
-
101
-
102
-
103
-
104
-
105
-
106
-
107
-
108
-
109
-
110
-
111
-
112
-
113
-
114
-
115
-
116
-
117
-
118
-
119
-
120
-
121
-
122
-
123
-
124
-
125
-
126
 |
 |

Moving and Storage
Fiscal 2011 Compared with Fiscal 2010
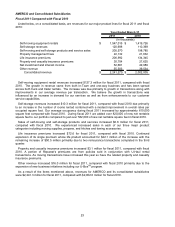
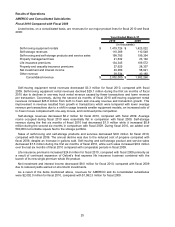
Listed below are revenues for the major product lines at our Moving and Storage operating segment for
the fiscal 2011 and fiscal 2010:
2011 2010
Self-moving equipment rentals $ 1,549,058 $ 1,421,331
Self-storage revenues 120,698 110,369
Self-moving and self-storage products and service sales 205,570 198,785
Property management fees 22,132 21,632
Net investment and interest income 25,702 26,055
Other revenue 54,666 38,150
Moving and Storage revenue $ 1,977,826 $ 1,816,322
(In thousands)
Year Ended March 31,
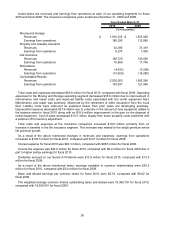
Self-moving equipment rental revenues increased $127.7 million for fiscal 2011, compared with fiscal
2010. The growth in revenue came from both In-Town and one-way business and has been spread
across both truck and trailer rentals. The increase was due primarily to growth in transactions along with
improvements in our average revenue per transaction. We believe the growth in transactions was
influenced by an increase in demand for our services as well as from enhancements to our customer
service capabilities.
Self-storage revenues increased $10.3 million for fiscal 2011, compared with fiscal 2010 due primarily
to an increase in the number of rooms rented combined with a modest improvement in overall rates per
occupied square foot. Our average occupancy during fiscal 2011 increased by approximately 610,000
square feet compared with fiscal 2010. During fiscal 2011, we added over 820,000 of new net rentable
square feet to our portfolio compared to just over 582,000 of new net rentable square feet in fiscal 2010.
Sales of self-moving and self-storage products and services increased $6.8 million for fiscal 2011,
compared with fiscal 2010. In particular we experienced increased sales in each of our three major
product categories including propane, hitches and towing accessories and moving supplies.
Other revenue increased $16.5 million for fiscal 2011, compared with fiscal 2010 primarily from the
expansion of new business initiatives including our U-BoxTM program.
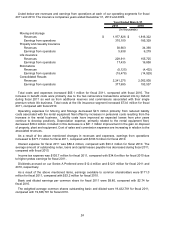
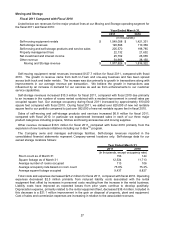
The Company owns and manages self-storage facilities. Self-storage revenues reported in the
consolidated financial statements represent Company-owned locations only. Self-storage data for our
owned storage locations follows:
2011 2010
Room count as of March 31 153 144
Square footage as of March 31 12,534 11,713
Average number of rooms occupied 113 106
Average occupancy rate based on room count 75.8% 75.2%
Average square footage occupied 9,437 8,827
Year Ended March 31,
(In thousands, except occupancy rate)
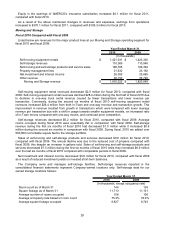
Total costs and expenses decreased $23.2 million for fiscal 2011, compared with fiscal 2010. Operating
expenses decreased $2.5 million primarily from reduced liability costs associated with the rental
equipment fleet offset by increases in personnel costs resulting from the increase in the rental business.
Liability costs have improved as expected losses from prior years continue to develop positively.
Depreciation expense, primarily related to the rental equipment fleet, decreased $38.4 million. Included in
this decrease is a $21.1 million improvement in the gain on disposal of property, plant and equipment.
Cost of sales and commission expenses are increasing in relation to the associated revenues.
27