U-Haul 2011 Annual Report Download - page 39
Download and view the complete annual report
Please find page 39 of the 2011 U-Haul annual report below. You can navigate through the pages in the report by either clicking on the pages listed below, or by using the keyword search tool below to find specific information within the annual report.-
 1
1 -
2
-
3
-
4
-
5
-
6
-
7
-
8
-
9
-
10
-
11
-
12
-
13
-
14
-
15
-
16
-
17
-
18
-
19
-
20
-
21
-
22
-
23
-
24
-
25
-
26
-
27
-
28
-
 29
29 -
 30
30 -
 31
31 -
 32
32 -
 33
33 -
 34
34 -
 35
35 -
 36
36 -
 37
37 -
 38
38 -
 39
39 -
 40
40 -
 41
41 -
 42
42 -
 43
43 -
 44
44 -
 45
45 -
 46
46 -
 47
47 -
 48
48 -
 49
49 -
50
-
51
-
52
-
53
-
54
-
55
-
56
-
57
-
58
-
59
-
60
-
61
-
62
-
63
-
64
-
65
-
66
-
67
-
68
-
69
-
70
-
71
-
72
-
73
-
74
-
75
-
76
-
77
-
78
-
79
-
80
-
81
-
82
-
83
-
84
-
85
-
86
-
87
-
88
-
89
-
90
-
91
-
92
-
93
-
94
-
95
-
96
-
97
-
98
-
99
-
100
-
101
-
102
-
103
-
104
-
105
-
106
-
107
-
108
-
109
-
110
-
111
-
112
-
113
-
114
-
115
-
116
-
117
-
118
-
119
-
120
-
121
-
122
-
123
-
124
-
125
-
126
 |
 |

Our borrowing strategy is primarily focused on asset-backed financing and rental equipment operating
leases. As part of this strategy, we seek to ladder maturities and hedge floating rate loans through the
use of interest rate swaps. While each of these loans typically contains provisions governing the amount
that can be borrowed in relation to specific assets, the overall structure is flexible with no limits on overall
Company borrowings. Management feels it has adequate liquidity between cash and cash equivalents
and unused borrowing capacity in existing facilities to meet the current and expected needs of the
Company over the next several years. At March 31, 2011, we had cash availability under existing credit
facilities of $232.6 million as well as $40.6 million from a securitized fleet loan to be used for new
equipment purchases. It is possible that circumstances beyond our control could alter the ability of the
financial institutions to lend us the unused lines of credit. We believe that there are additional
opportunities for leverage in our existing capital structure. For a more detailed discussion of our long-term
debt and borrowing capacity, please see Note 9, Borrowings of the Notes to Consolidated Financial
Statements.
Fair Value of Financial Instruments
On April 1, 2008, assets and liabilities recorded at fair value on the consolidated balance sheets were
measured and classified based upon a three tiered approach to valuation. ASC 820 requires that financial
assets and liabilities recorded at fair value be classified and disclosed in a Level 1, Level 2 or Level 3
category. For more information, please see Note 16, Fair Value Measurements of the Notes to
Consolidated Financial Statements.
The available-for-sale securities held by the Company are recorded at fair value. These values are
determined primarily from actively traded markets where prices are based either on direct market quotes
or observed transactions. Liquidity is a factor considered during the determination of the fair value of
these securities. Market price quotes may not be readily available for certain securities or the market for
them has slowed or ceased. In situations where the market is determined to be illiquid, fair value is
determined based upon limited available information and other factors including expected cash flows. At
March 31, 2011, we had $1.4 million of available-for-sale assets and $0.2 million of other liabilities
classified in Level 3.
The interest rate swaps held by the Company as hedges against interest rate risk for our variable rate
debt are recorded at fair value. These values are determined using pricing valuation models which
include broker quotes for which significant inputs are observable. They include adjustments for
counterparty credit quality and other deal-specific factors, where appropriate and are classified as Level
2.
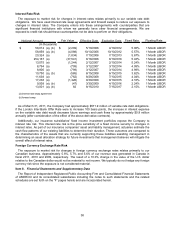
Disclosures about Contractual Obligations and Commercial Commitments
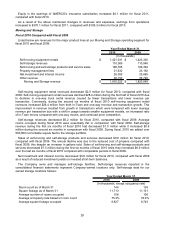
The following table provides contractual commitments and contingencies as of March 31, 2011:
Contractual Obligations Total
Prior to
03/31/12
04/01/12
03/31/14
04/01/14
03/31/16
April 1, 2016
and Thereafter
Notes, loans and leases payable - Principal $ 1,397,842 $ 147,859 $ 412,309 $ 535,072 $ 302,602
Notes, loans and leases payable - Interest 302,717 79,168 124,427 75,172 23,950
Revolving credit agreements - Principal - - - - -
Revolving credit agreements - Interest - - - - -
Operating leases 566,344 152,934 248,059 148,586 16,765
Property and casualty obligations (a) 109,040 12,130 13,643 10,491 72,776
Life, health and annuity obligations (b) 1,833,002 133,845 246,126 204,869 1,248,162
Self insurance accruals (c) 397,381 110,493 169,106 78,605 39,177
Post retirement benefit liability 9,971 596 1,485 1,922 5,968
T
ota
l
contractua
l
o
bli
gat
i
ons $ 4,616,297 $ 637,025 $ 1,215,155 $ 1,054,717 $ 1,709,400
Payment due by Period (as of March 31, 2011)
(In thousands)
(a) These estimated obligations for unpaid losses and loss adjustment expenses include case reserves for reported claims and
incurred but not reported (“IBNR”) claims estimates and are net of expected reinsurance recoveries. The ultimate amount to settle
both the case reserves and IBNR is an estimate based upon historical experience and current trends and could materially differ from
actual results. The assumptions do not include future premiums. Due to the significant assumptions employed in this model, the
amounts shown could materially differ from actual results.
34